fbpx

New Zealand Dollar Moving Beautifully in 2013

In the last quarter of 2012, the $GBPNZD pushed lower to the bottom of the channel at the 1.90 major large quarter point and psychological level. This new low broke strong support levels at 1.9370 and 1.9270. So while it certainly seemed that kiwi was staging a breakout against sterling, $GBPNZD failed to push to new lows below the previous 08/14/2012 low at 1.8962. Instead, price bounced off its channel bottom and headed all the way back to the top of the channel at 1.98.

GBPNZD weekly chart

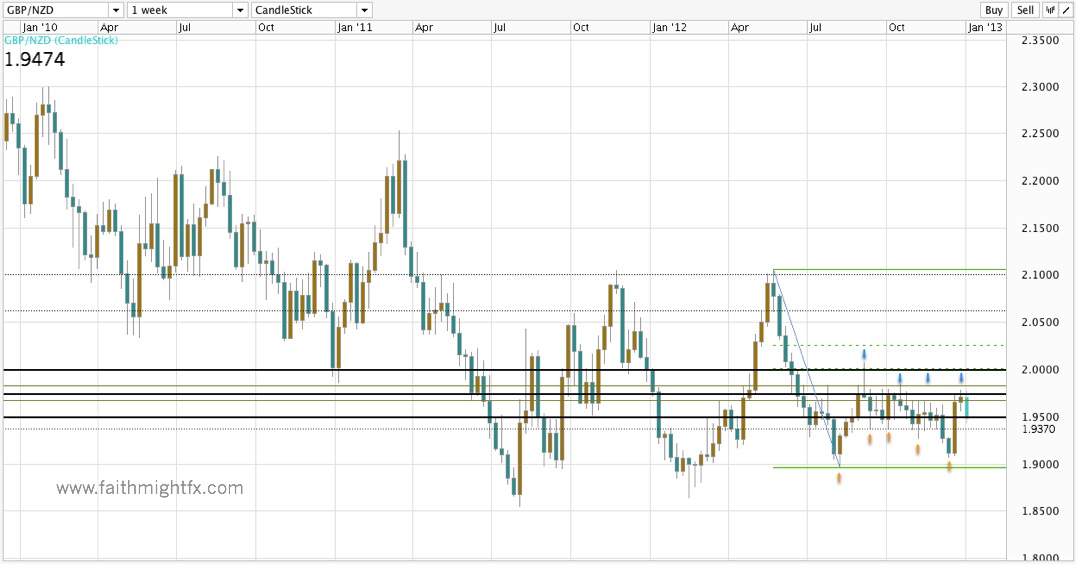
With the range top at 1.98 holding as resistance, price moved decisively lower with spikes below 1.95 in the 1st trading day of 2013. If momentum continues, price should move lower to the bottom of the range and test support levels at 1.9370 and 1.9270.

GBPAUD daily chart

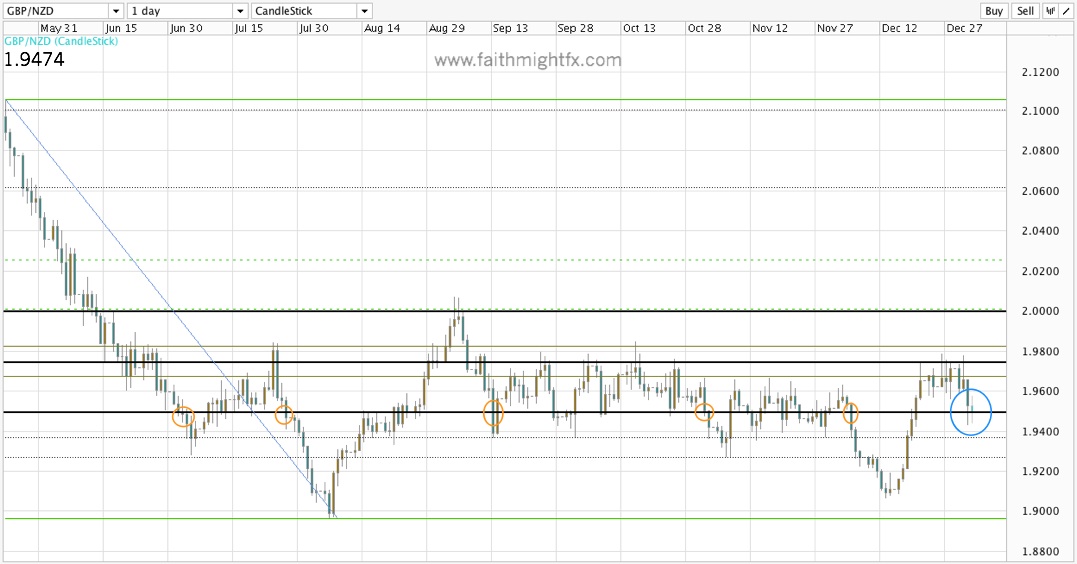
Looking at the daily chart too, candle closes below 1.95 have led to more price moves lower.  So while short term momentum looks bearish, the $GBPNZD is still rangebound on the bigger timeframes.

End of Year Breakout Fizzles In 2013

Not long after writing on the bearish outlook of the $GBPAUD, the pair staged a breakout above 1.5425 resistance:

Pops higher, however, should be met by sellers at or ahead of 1.5425 resistance level aiming to take price towards 1.50 in the coming weeks. Only a close above 1.55 changes the short term momentum to bullish.

It seemed as if the pair was turning bullish as it based at 1.50 even ahead of the 61.8% Fibonacci retracement level of the latest bullish wave. When a pair respects its Fibonacci levels on a correction lower, we expect that pair to make a new high higher than the previous high. The $GBPAUD failed to do so. Instead, the breakout fizzled at 1.5676 and has since turned lower.

GBPAUD weekly chart

Despite closing the year above 1.55, the $GBPAUD started off the 1st full day of 2013 trading dropping below that major 1.55 level. Looking to the left of the chart, we can see that previous breaks lower that closed the week below 1.55 saw momentum carry price lower.

GBPAUD daily chart

Even on a smaller time frame, the daily chart, a candle close below 1.55 followed by a subsequent candle close below 1.55 saw a price drop as low as 1.5250.

So despite closing the year above 1.55, the $GBPAUD still looks bearish. It remains to be seen if this is the year the pair resumes its long term bear trend to new lows below 1.4700.

Happy 2013

Sterling leaves 2012 with its larger trends still very much in play. Of course, the $GBPUSD is the outlier as the USD enters 2013 embroiled in political rubbish. However, all the pairs highlighted in November 2012 enter 2013 with the long term trends still largely in play.

  1. GBPAUD False Break Short-lived
joypeace
Happy 2013!