Last week, Janet Yellen changed the game. This supposed uber-dove fooled us. She came out hawkish without really rattling markets. She is reigning in the USD. Contrary to those that say she’ll retract later, markets may come to find out that Yellen is serious. She is much more hawkish than the market ever expected. Can the USD strengthen on this change?
GBP/USD
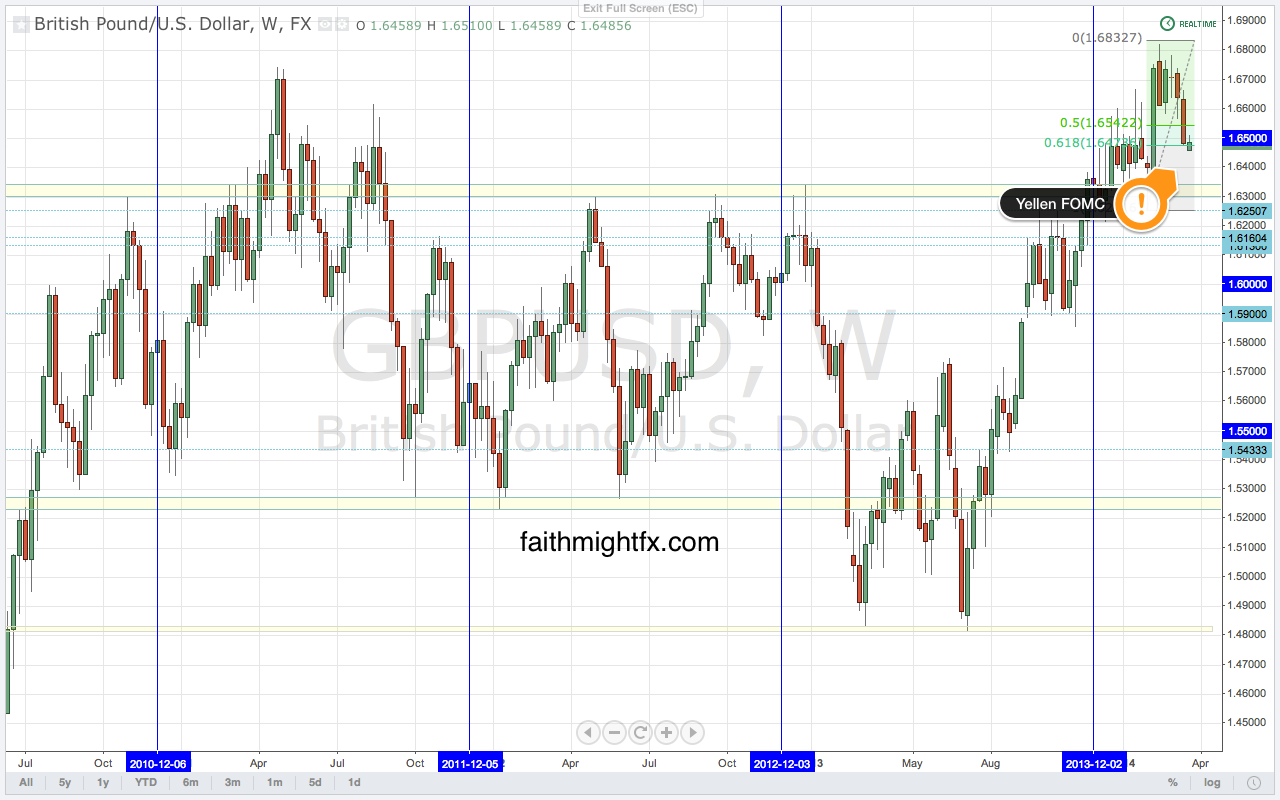
$GBPUSD declined last week to 1.65 even breaking below the big psychological level on the back of Yellen’s hawkish rhetoric last week. The technical picture looks broken as cable closed the week below 1.65 for the 1st time since January. Price breaks the 61.8% Fibonacci level at 1.6467. It looks like another failed breakout on the weekly chart. Just when cable had everyone yelling for 1.70 (even yours truly), markets once again make a sucker out of everyone. If $GBPUSD is unable to find support above 1.6500, this would signal a reversal back to 1.6250. Is the Yellen spark enough to break that level? That’s the more interesting price action for market sentiment. And the Yellen FOMC just became the 1st central banks to raise interest rates AND remove QE.
EUR/GBP
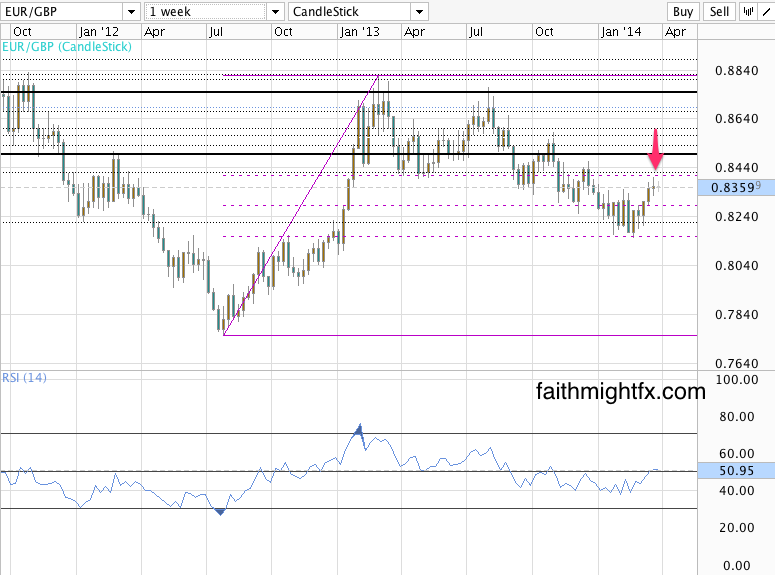
The $EURGBP has managed to stage a rally higher than expected finding resistance right at the 0.8400 level. Price now remains trapped in a range between 0.8330 and 0.8400. However, it seems that the EUR will find difficulty rallying in the face of weak economic data and a still dovish ECB. If price breaks below 0.8330, losses could accelerate back to the 0.8250. But it remains to be seen how much EUR can really rally on its own fundamentals. This may be the only currency that sterling can rally against. If 0.8250 holds then we’ll be back to these levels again with resistance at 0.8400.
GBP/CAD
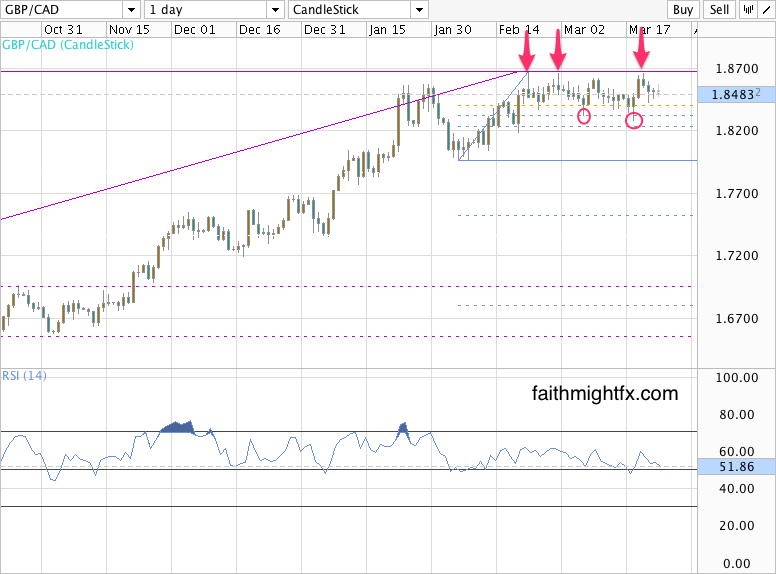
Canadian data continues to support a weak CAD which only continues to support the $GBPCAD at its 2014 highs. However, this pair is having a difficult time breaking any higher above 1.8650. Price continues to pivot around 1.8500. The fundamentals in this pair continue to favor the bulls. But can it really rally when GBP is weak in all the other pairs. I’m not so sure.
GBP/NZD
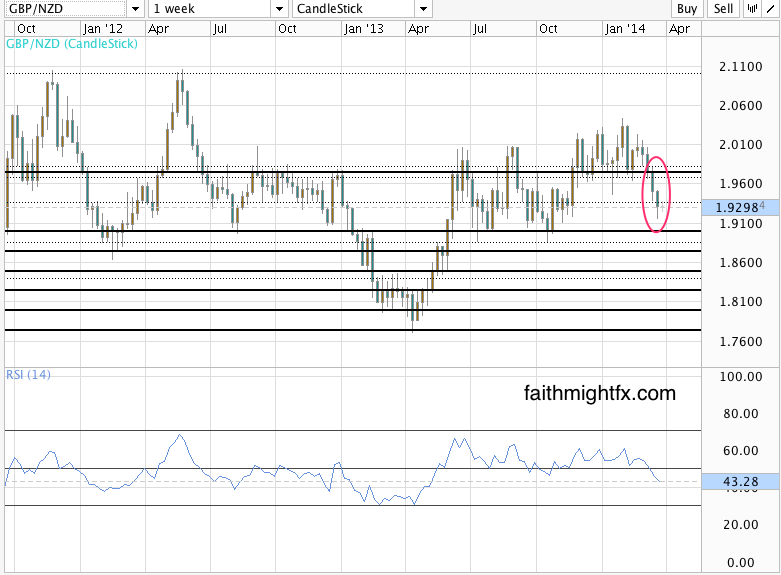
There has been a major breakdown in the $GBPNZD causing a reversal on the daily chart. During the consolidation of the $GBPUSD, the $GBPNZD was holding up quite well in its own consolidation. But the effects of the Ukraine-Russia conflict have sparked a rally in commodities and with it the NZD. As such, the correction that was taking place in the $GBPNZD and finding support at 1.9500 broke down further last week. Price managed to completely reverse this year’s rally moving to back to lows on the daily chart. The level to watch is 1.9100. A break below moves prices toward 1.9000 with major support at 1.8850. However, if price finds support at 1.9100 then it moves back to 1.9500. Watch out also for intervention from the RBNZ if the NZD continues to find strength.
GBP/AUD
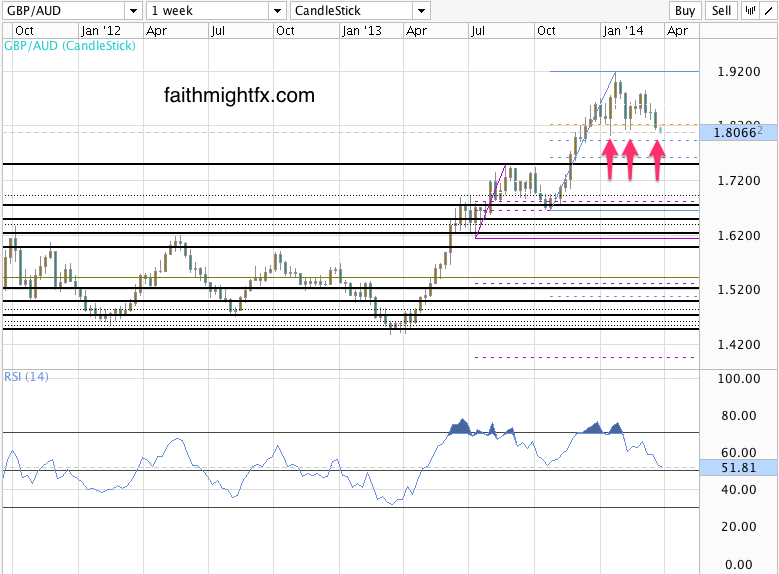
The $GBPAUD is benefiting even more from the rally in commodities even as the Chinese economy, Australia’s biggest trading partner, continues to slow. There is also a massive head and shoulders chart pattern on the daily chart that many traders are looking to resolve to even lower levels. Based on this chart pattern, price could decline to 1.7600 which is the huge 61.8% Fibonacci retracement level on the weekly chart. Even a 400-pip decline from current levels wouldn’t change the bullish bias on the long term chart. But will the RBA allow the AUD to strengthen that much? RBA intervention is a real possibility if $GBPAUD breaks this support at 1.8000.
GBP/JPY
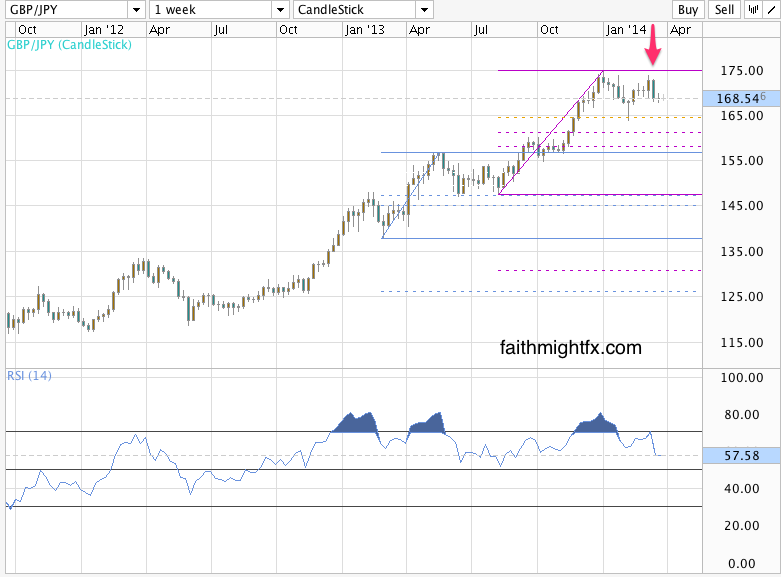
Despite the bull trend on the daily chart, $GBPJPY has fallen below the big psychological level at 170.00. Even while the pair is finding support at 167.50, a break below 167.30 signals a price move to 163.80/164.00 support. Only a close back above 170.00 can change this new bearish sentiment in the $GBPJPY. A move lower will be choppy as the bull trend no doubt still has many buyers with the $GBPJPY still only in a shallow retracement.

