
The GBP has experienced a selloff that I believe may be the beginning of a reversal. Data misses at a time when the market has gotten used to better-than-expected data is probably the biggest reason for a reversal to take hold. You can look at the market’s reaction to good news the past 2 days versus yesterday’s manufacturing miss in the chart below. The Bank of England’s hold on monetary policy today was expected to be a non-event. They delivered. Consequently, they have given markets an excuse to sell pounds short term. Traders are already looking ahead to the August Inflation Report that Mark Carney will deliver next week. If BoE telegraphs concern for a weaker economy going forward, we could see sterling really start to give back the gains of the past year.
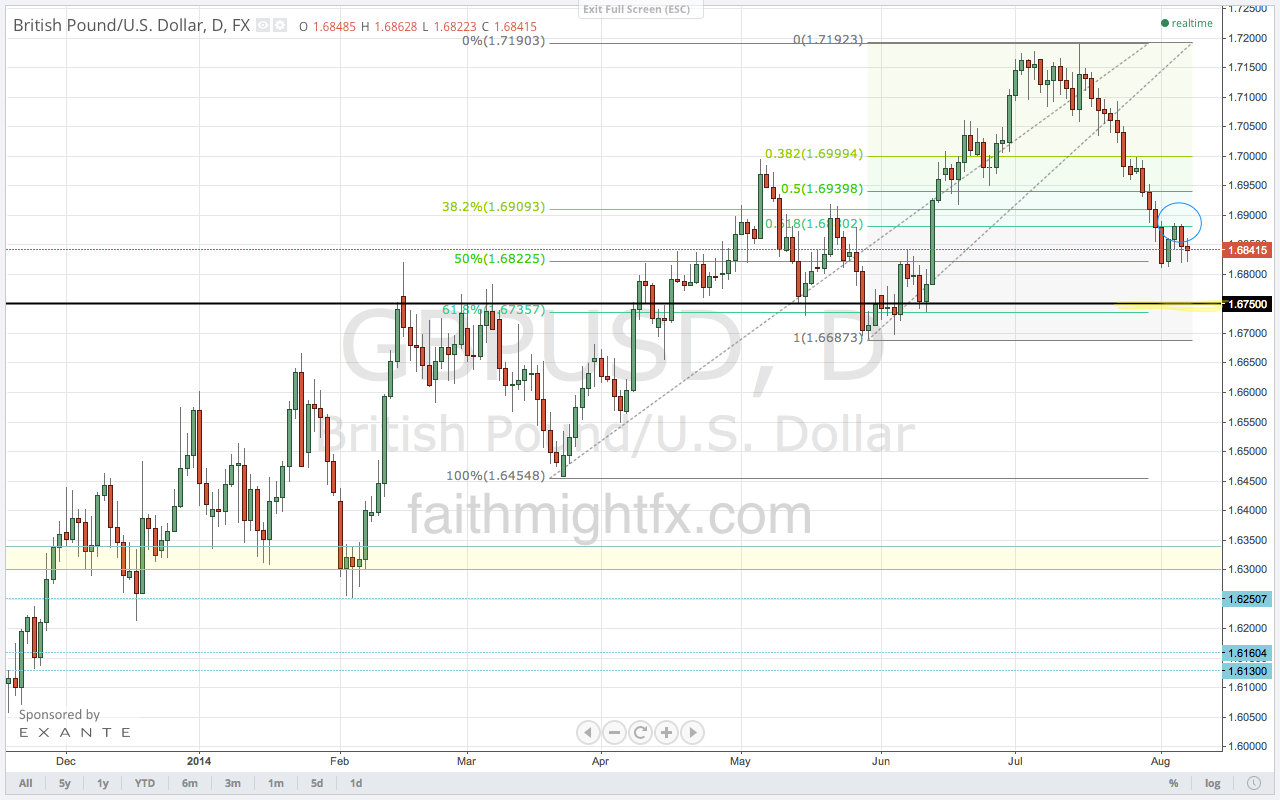
Even with $GBPUSD now trading well below 1.7000, I came into the week skeptical of this reversal. So I’ve been watching this week. Not much tweeting. Much more watching. What has developed is $GBPUSD having a hard time getting above 1.6880. This difficulty has given more evidence to the huge support level this level really was. It wasn’t just a 61.8% Fibonacci level. It is a level where supply meets demand. It is a level where buyers and sellers alike must make a decision. It looks like sellers are now in control with the break last week and the hold this week of 1.6880. And those capital flows are moving throughout the market as we see selloffs in the $GBPNZD, $GBPCAD and $GBPJPY. I expect bounces to be met by offers at 1.6880 and, on a break higher, at the more obvious 1.7000 psychological level.
Trade what you see.
Read also: The Sterling Digest Special Edition (FXStreet)