
1.66 remains key $GBPUSD— Lydia Idem Finkley (@faithmight) August 25, 2014
Another slow session, another day this remains true. In order to really belabor the point, I wanted to post the price action that has developed in the past week. The chart pretty much says it all.
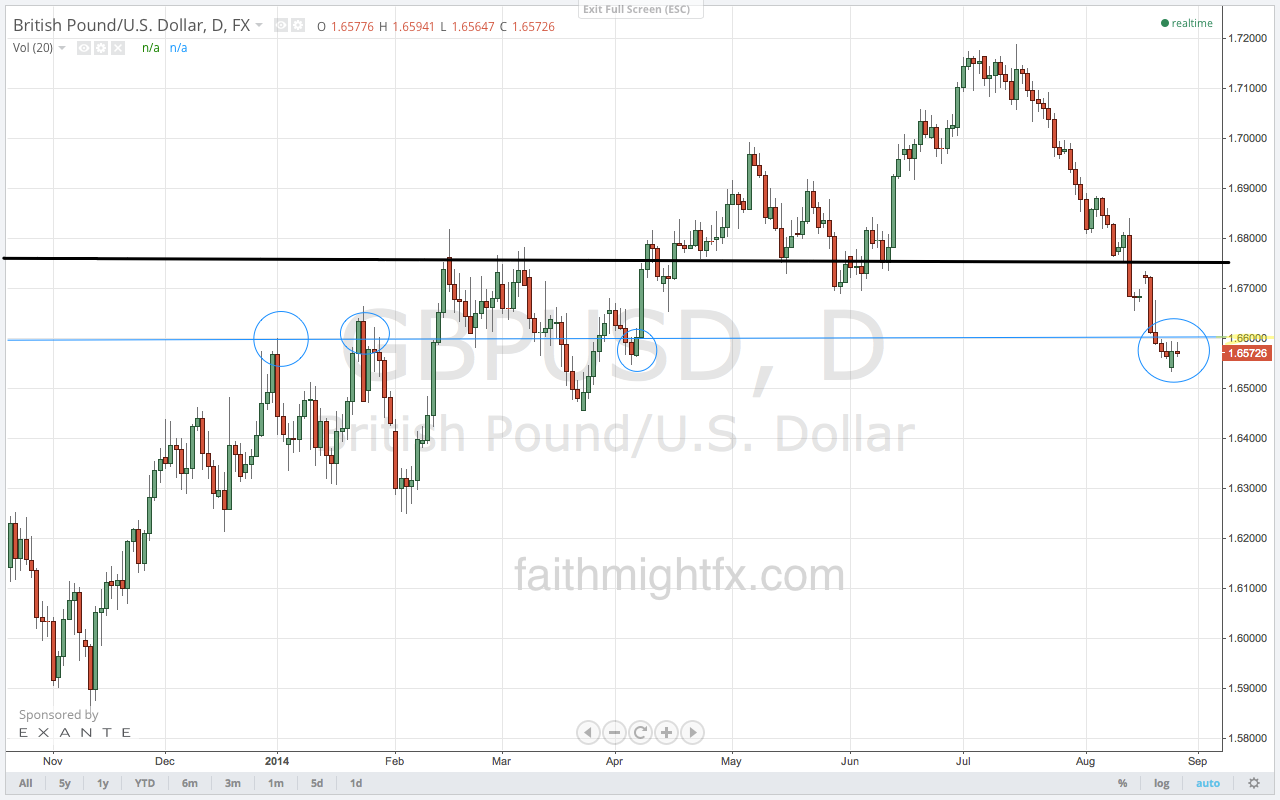
A hold below targets the bottom of the chart long term. This 1.6600 is nearly the 61.8% Fibonacci level on the weekly chart that was broken last week – the ultimate perversion of any long-running trend. The fact that the range top is this critical support level is not lost on me. But there are still bulls out there. Given the breakout rally over the last year, I understand the sentiment. And so the hold below 1.6600 has been met with just enough dip buyers to keep price supported. If strength does build above 1.6600, then a hold above it starts a correction that makes 1.6650 a key resistance zone. If this is really a reversal, price will hold below 1.6650 on any moves to the upside above 1.6600. If bulls really do have some mojo, we’ll see price break higher to 1.6750.