
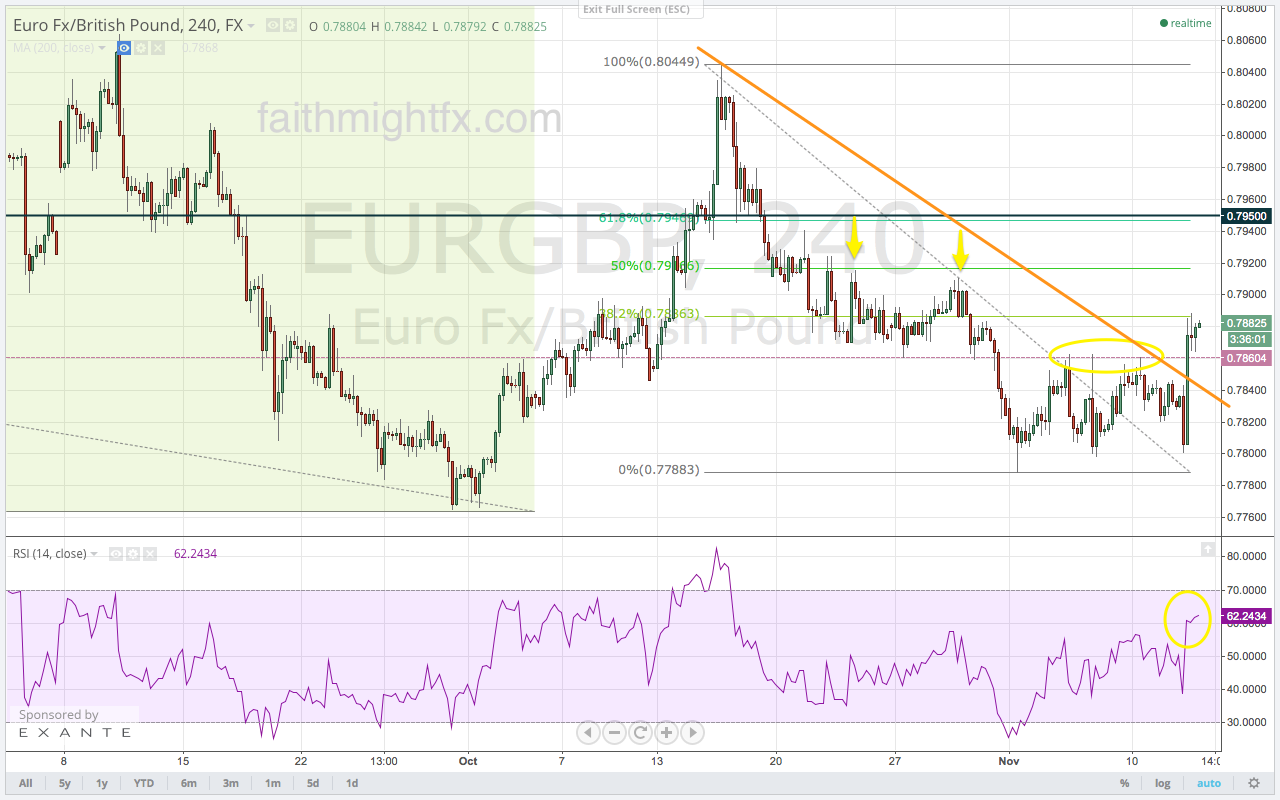
So far, the $EURGBP remains stuck in its huge wedge formation. Price has found resistance all trading session at the 0.7860 level. However, swing traders are looking to the 38.2% Fibonacci level at 0.7880 and 0.7920-70 for an indication of supply and demand. That’s the upside potential.
Since publishing the above at the start of October, the $EURGBP did go higher to 0.8050-70 only to fall back again and put in a higher low. In fact, there are several factors at play currently that may suggest that price could actually rally a little higher still:
- Euro sentiment is a extremely bearish levels. The premise goes that when sentiment for asset classes are at extreme levels it is usually a signal in the opposite direction. Thanks to J.C. for sharing his EUR sentiment chart at Stocktoberfest.
- GBP weakness fundamentally continues to show through in the economic data. Data releases are still a mixed bag but a year ago we had much stronger data released month-over-month than we having been getting now in recent months.
- Today’s break of resistance is supported by a break higher in the RSI which has supported a move higher since price put in the higher low last week.
- Bonus: For all you trendline followers, today’s price action has moved the $EURGBP comfortably above the trendline resistance coinciding nicely with the 7860 resistance level was capping price all week .
On the bigger timeframes, the $EURGBP still favors bears long-term. However, it is hard to ignore the price developments of the past 24 hours that point to higher price levels. Expect swing sellers to set up at the higher levels. But if price rallies through the 0.8050 resistance levels, expect the EUR to look for higher still.