
The $EURGBP broke to marginally new lows in last week’s trading. Only slightly new, by 22 pips, but new lows nonetheless. The EUR collapsed against all currencies because European Central Bank Governor Mario Draghi continued to deliver dovish rhetoric last week. So on the back of his comments, the $EURGBP fell down to the long-term support at 0.7750.
The $EURGBP had been rangebound for months heading into the new year between 0.8050 and 0.7750. Upon pressing into new lows last week, we note that the RSI on the daily chart put in a higher low. In fact, this bullish divergence on the RSI is even more pronounced on the weekly chart.
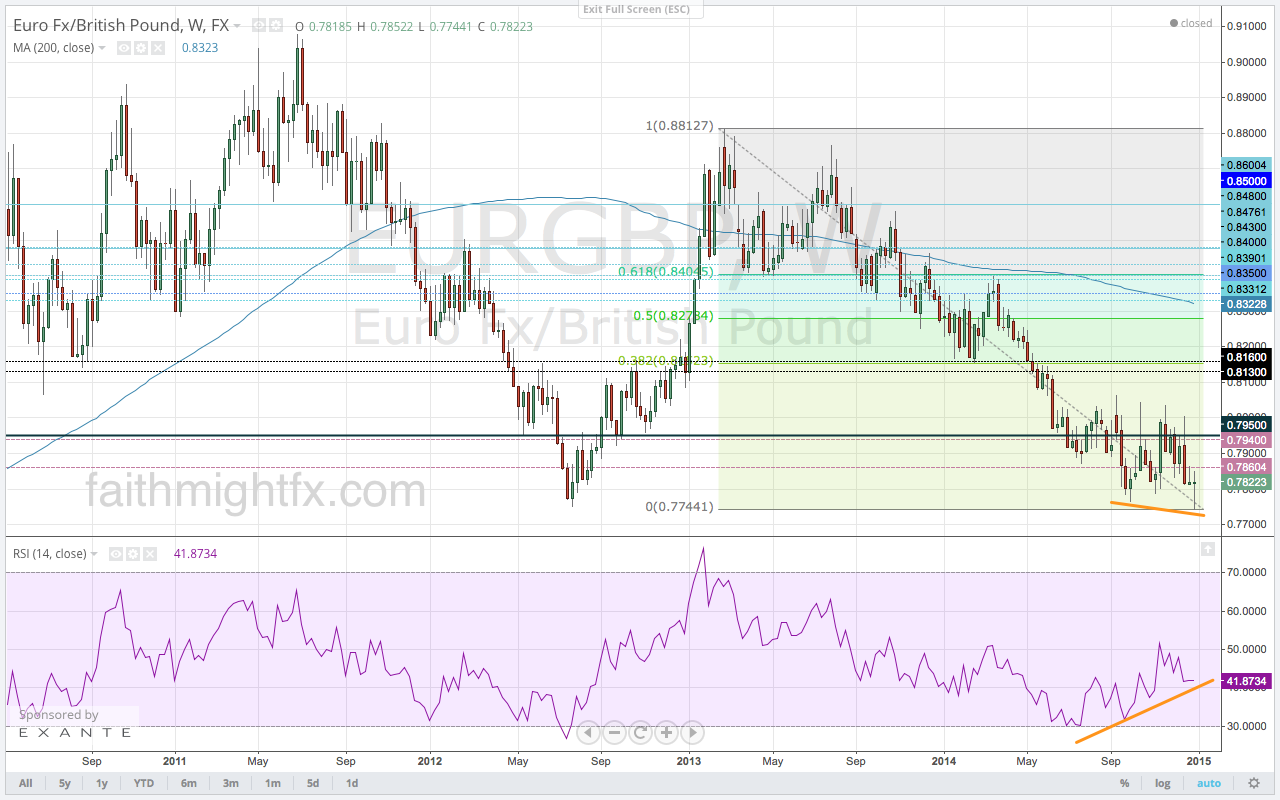
The RSI is very suggestive of bullish price action. However, the bulls cannot get too excited. Because also on the weekly chart is a candlestick candle of indecision. For when you see that the $EURUSD has fallen to multi-year lows, it stands to reason that the $EURGBP should have broken this long-term support level quite handedly. However, what we see is that GBP weakness overtook this pair as buyers stepped in at the support level. So given what we see on the weekly chart with this false breakdown coupled with the bullish divergence in the RSI, the prudent action may be to set up at the lows for a move higher especially as we see continued weakness in the $GBPUSD.