
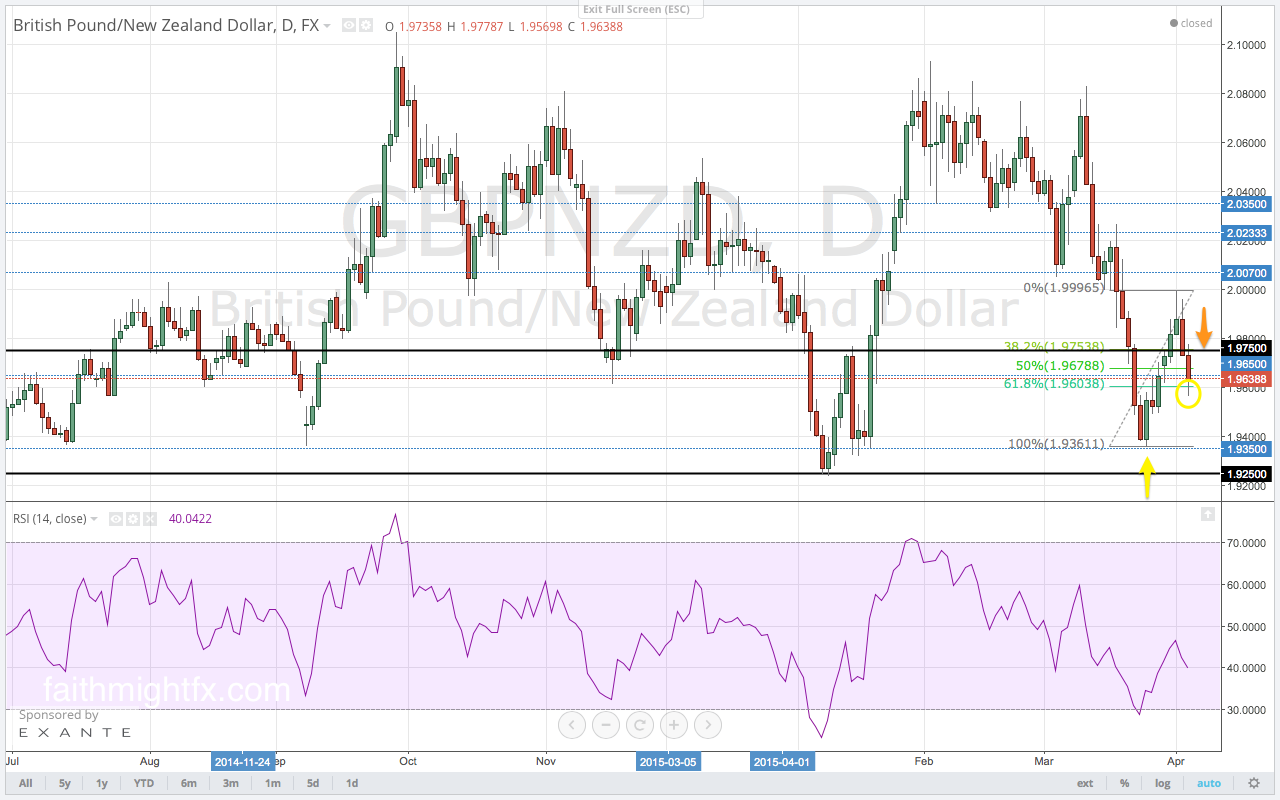
The GBP/NZD rallied as expected last week. It moved higher past the Fibonacci levels to the high at 1.9996. However, the 2.00 level served as formidable resistance for last week’s rally. As warned last week (Volume 5), the pair immediately gave up 2 support levels below the 2.00 resistance when it moved back to 1.9824 after the high. It was at this point, even after the subsequent bounce out of that level to 1.9965, that sellers took back control of the GBP/NZD.
The pullback from the 2.00 resistance level has already breached the 61.8% Fibonacci level of last week’s rally. That is one signal that price will continue lower but it a tentative signal. The GBP/NZD is a volatile pair so an overshoot of levels is not a definitive indication of direction. However, momentum on the RSI is still squarely in bearish territory even after the rally to 1.9996. From this point of view, the GBP/NZD is biased to move lower to support at 1.9350.
The GBP/NZD remains range bound between 2.0800 and 1.9350. However, given the failure at the middle of the range it is likely that a return to the range bottom might push to new lows towards 1.9250. This level is the extreme range bottom, if you look at the entire range between 2.1055 and 1.9250. With the RSI on the weekly chart also firmly in the sellers territory, there it seems sellers are looking to push lower than the 1.9569 lows of last week.
This is an excerpt from this week’s issue of Quid Report. Subscribers receive my research on all major GBP pairs at the top of the week, including access to @faithmightfx on Twitter for daily, real-time calls and adjustments to the weekly report. AVAILABLE NOW.