
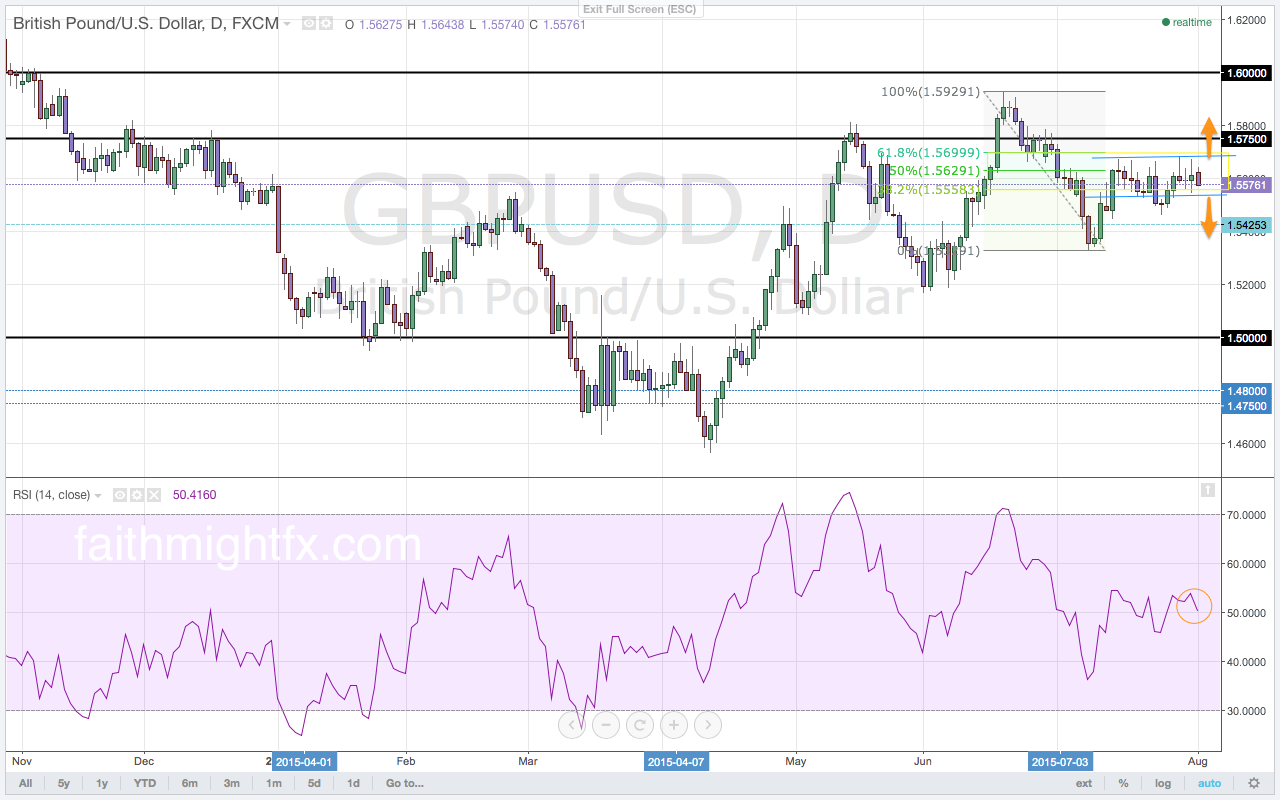
After three weeks of trading, the USD has been unable to move the $GBPUSD lower since the lows at 1.5329. The rout in the commodity markets, from wheat to iron ore and from oil to diary, has strengthened the USD. Federal Reserve Governor Yellen continues to hint towards higher interest rates in 2015. The Federal Reserve rather be ahead of the curve on inflation by increasing interest rates even as oil falls and despite the already strong USD. With weak commodities and a pending U.S. interest rate increase, the $GBPUSD looks to resume its overall downtrend. However, the $GBPUSD has become stuck in a range of increasingly higher lows and higher highs. As such, the bullish bias has returned to the $GBPUSD. The longer the $GBPUSD remains above the 1.5500 level, the probability increases for the next move to be to the upside. Such an upside move looks to the complete the Fibonacci move with a rally that breaks above the 1.5929 highs. The 1.5700 level is now a key level for direction to the upside. A confirmed break above that area of resistance signals a resumption of the rally. Momentum is in bullish territory though the hold below the 60.0 level on the RSI holds bearish implications. The 1.5250 support level is a key level for direction to the downside. A confirmed break below this level will accelerate $GBPUSD losses back to the 1.5169 lows to complete the reversal kicked off by the break below 1.5459 (Volume 19).
Over the last several trading weeks, it has become peculiar to see the $GBPUSD unable to move lower as the USD surges against commodities during the same time period. The $GBPUSD carved a range of consolidation in the sell zone on the daily chart. The highs of the range above the 1.5600 level are simply a series of failed highs after bouncing out of the Fibonacci levels on the weekly chart. Without a move back to lows after spending four weeks above the 1.5500 support level, the $GBPUSD now looks to move higher still. The USD rally continues to loose momentum with every weak economic release. A weakening economy may be enough to delay interest rates hikes in the U.S. despite the hawkish hints from Governor Yellen.
The biggest driver of a hawkish Federal Reserve was increasing inflation, particularly in wages. The release of the employment cost index showing a decline holds big implications for the release of the U.S. jobs report. If hourly wages decline in the release this week and confirm the weak employment cost index, the $GBPUSD aims to breaks above the top of the range. A break of the range to the upside looks to complete the Fibonacci move of the weekly chart. If, however, the jobs report is another strong report, the $GBPUSD will move lower in an attempt return to the 1.5329 lows. The key level to watch on a break of these lows is the larger 61.8% Fibonacci level at 1.5086. Given that this the bottom edge of a buy zone, there remains the possibility for a rally off new lows.
This is an excerpt from this week’s issue of QUID REPORT. Subscribers receive my research on all major GBP pairs at the beginning of the week, including access to @faithmightfx on Twitter for daily, real-time updates to the weekly report. AVAILABLE NOW.