
Oil markets rallied last week on the back of the weaker USD in light of no change in U.S. interest rates. The close on Friday is the first close above the 2.0500 resistance level since the week before Black Monday. The $GBPCAD opens the new trading week extending the rally further as risk appetite wanes in the general capital markets. If this week also ends above the 2.0500 resistance level, it confirms this tentatively bullish bias in the GBP/CAD.
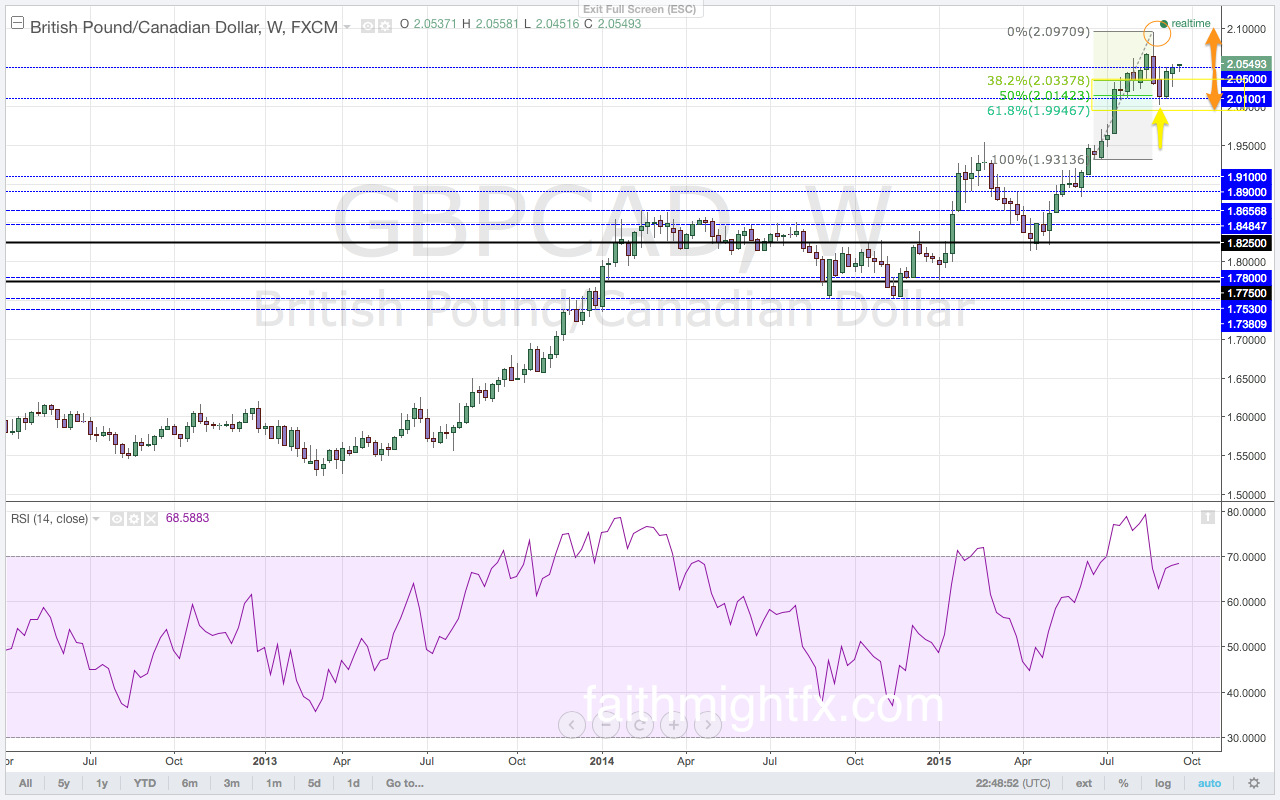
The Bank of Canada (BoC) surprised markets this month with no change in monetary policy. While the crude oil markets have plunged to new lows, the recent weeks have seen prices consolidate. The BoC feels that inflation remains inline with its outlook for the year. Though exports remain uncertain, the lower value in the Canadian dollar has helped to absorb the impact of low commodities by bolstering domestic demand. After already cutting interest rates twice this year, the BoC remains at ease with allowing those cuts to continue to work through the economy. Despite the cheerier disposition this month, the BoC remains a very dovish central bank as long as oil markets remain weak. There have even been whispers that the BoC may implement quantitative easing in 2016. With a less dovish stance in this month’s monetary policy statement, the Canadian dollar met with buying strength. This CAD strength pushed the $GBPCAD below the key 2.0100 support level. The $GBPCAD made new lows at 2.0028 before finding support and moving higher above the 2.0500 resistance level. The key 2.0100 support level remains the important level on a sustained move to the downside (Volume 22). However, last week price closed just above the 2.0500 resistance level. This resistance is the level to watch in the new trading week.
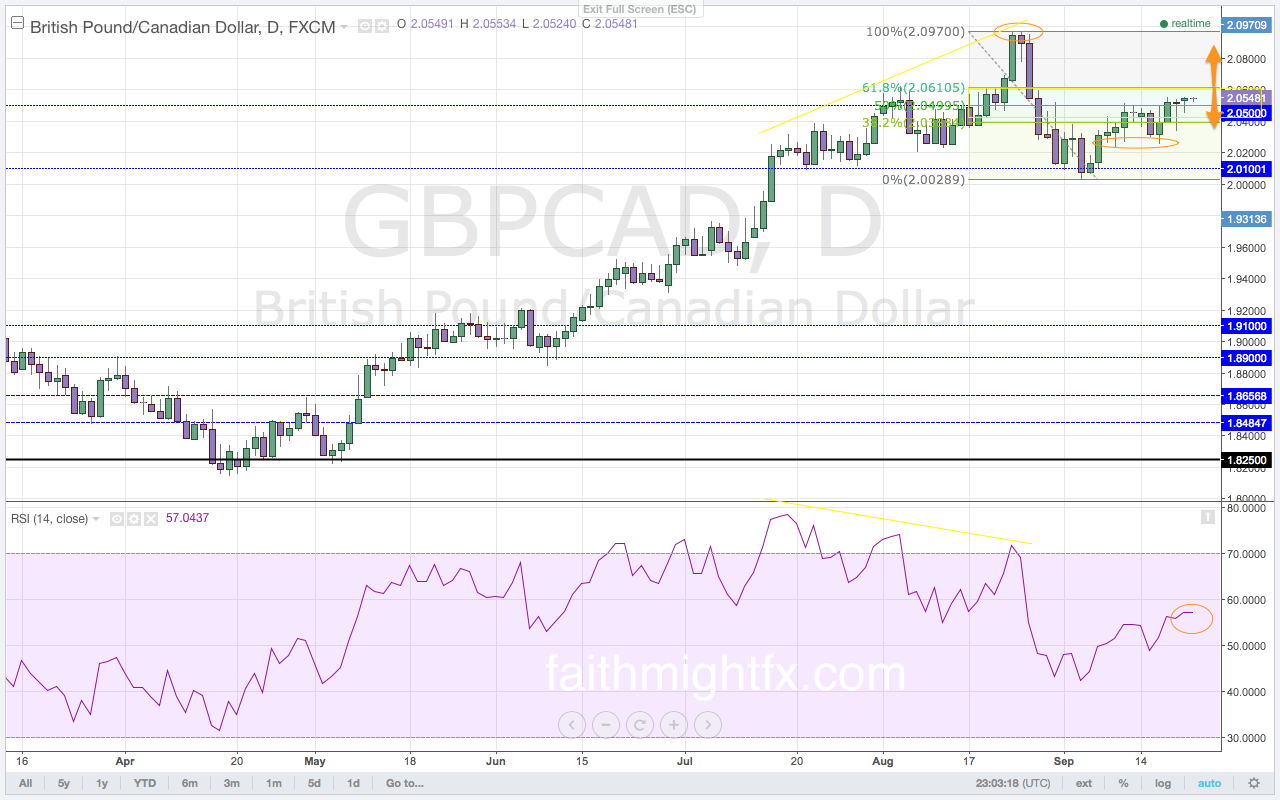
The $GBPCAD finally succumbed to the bearish divergence that had been building on the daily chart since mid-July. With a new low in momentum and a breach below the RSI 60.0 level, the $GBPCAD corrected lower to the 2.0028 lows before rallying higher off the lows. The follow through lower from the bearish divergence pushed momentum into selling territory last week. However, price was unable to close below the important 2.0100 support level with confirmation even with selling momentum behind it. The rally met profit-taking flows ahead of the weekend with the close at 2.0516. With confluence between the resistance level and the 50% Fibonacci level, there is staunch resistance at the 2.0500 level. As the rally extends higher in the open of the new trading week, momentum remains out of bearish territory. With a confirmed close above the resistance level, $GBPCAD looks to move higher. A break of the 61.8% Fibonacci level sees the $GBPCAD rally higher for a reversal back to the 2.0970 multi-year highs.
This is an excerpt from this week’s issue of QUID REPORT. Subscribers receive my research on all major GBP pairs at the beginning of the week, including access to @faithmightfx on Twitter for daily, real-time updates to the weekly report. AVAILABLE NOW.