fbpx

The EU-UK Tug of War

Back in 2019, populism took hold of the United Kingdom (UK) with the rise of Prime Minister Boris Johnson. In his first year, Johnson has executed on Brexit as promised and consolidated power around him. However, his inflexible, aggressive tactics has not earned him the same respect from the European Union (EU) officials.

And that was before the coronavirus pandemic, which has not made things easier for the UK nor the EU. Italy and Spain were hit hard by the disease, Johnson fell sick in March, and economies across Europe shut down in response to the pandemic. As a result, the British economy took a beating. On Friday, UK GDP reported a -17.4% for the past 3 months. The EU saw a contraction of -3.2% for the first quarter of this year. Q2 data is going to come in much worse.

EURGBP WEEKLY CHART, 14 JUNE 2020

The $EURGBP is playing this back-and-forth dynamic out in real time. Price action is rangebound, stuck between 0.9050 and 0.8850. Only a break and successful hold out of the range, changes that and restarts a trend direction. Play the range until it breaks. What will finally break the range? The nice thing as traders is that we don’t need to know why. Watch the levels and let price do its work.


If you are interested in learning how I found these levels, please check out the CHARTS101 course. Read the charts for yourself so you can trade what you see and not what I think.

Read more:

The Next Bear Market Could Be In Bonds

There is always a bull market somewhere.

Jim Cramer

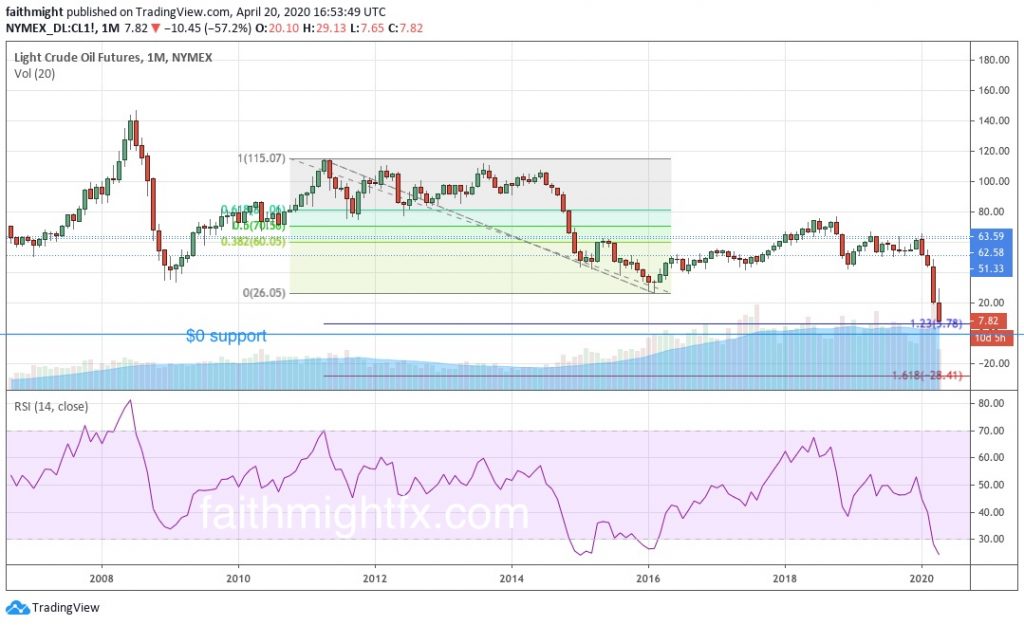
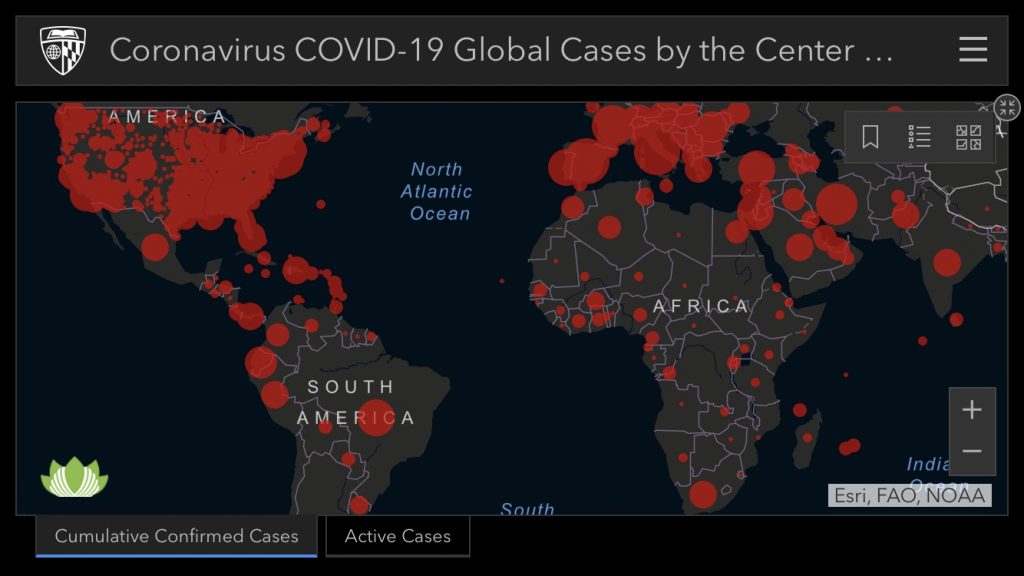
When oil markets turned negative in April, gold was making new highs at the time. When stocks crashed 2 months ago, bonds made all time highs. Investors have to start seeing price crashes as a signal of opportunity…opportunity in other markets.

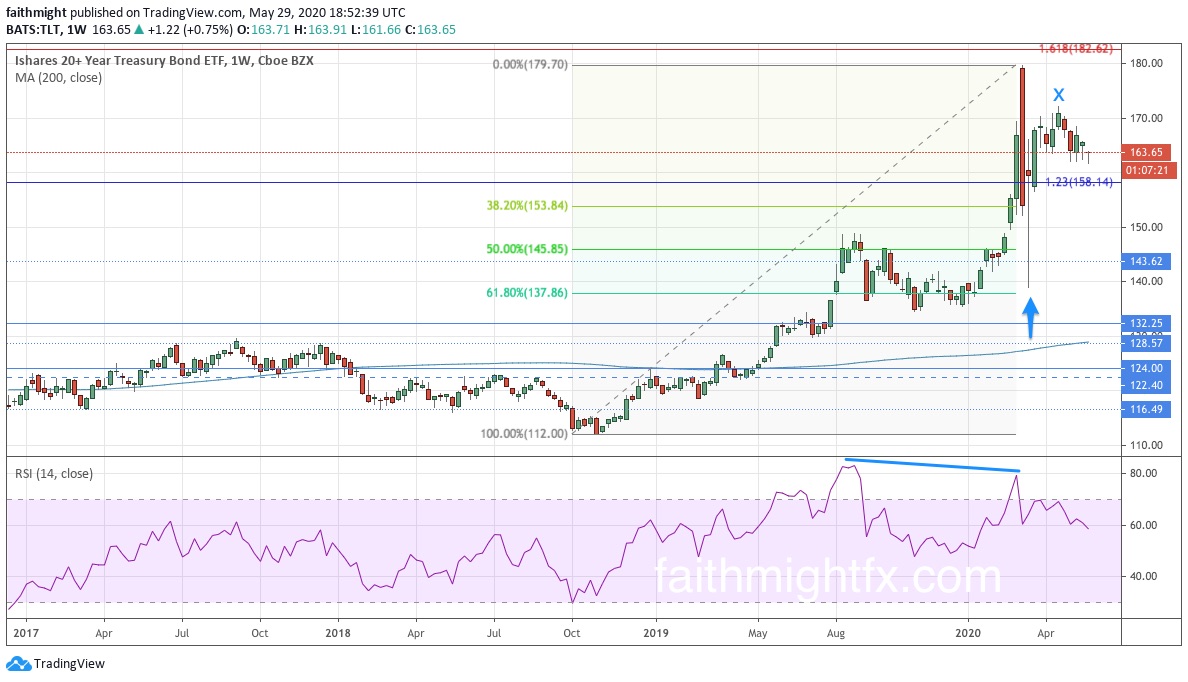
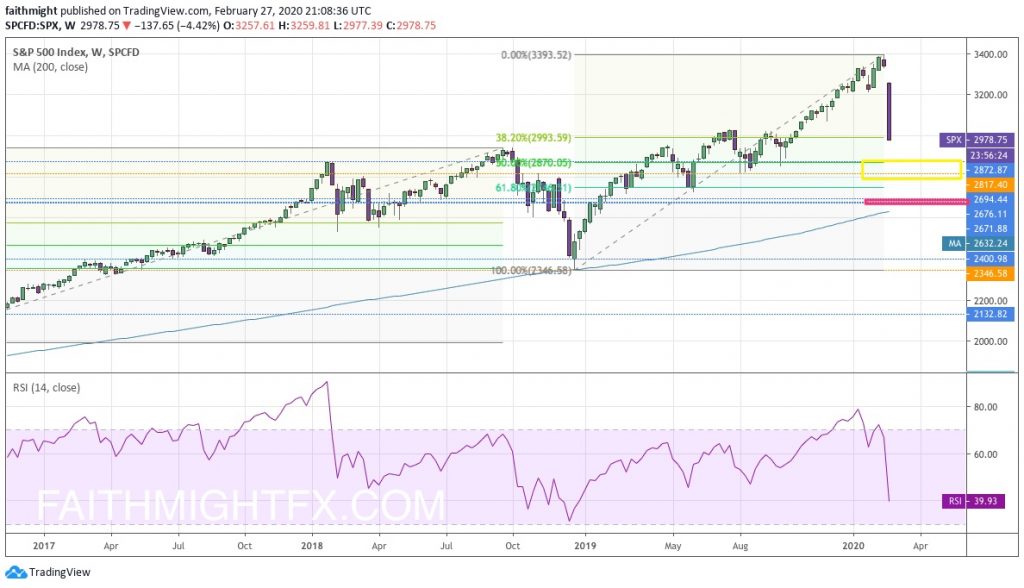
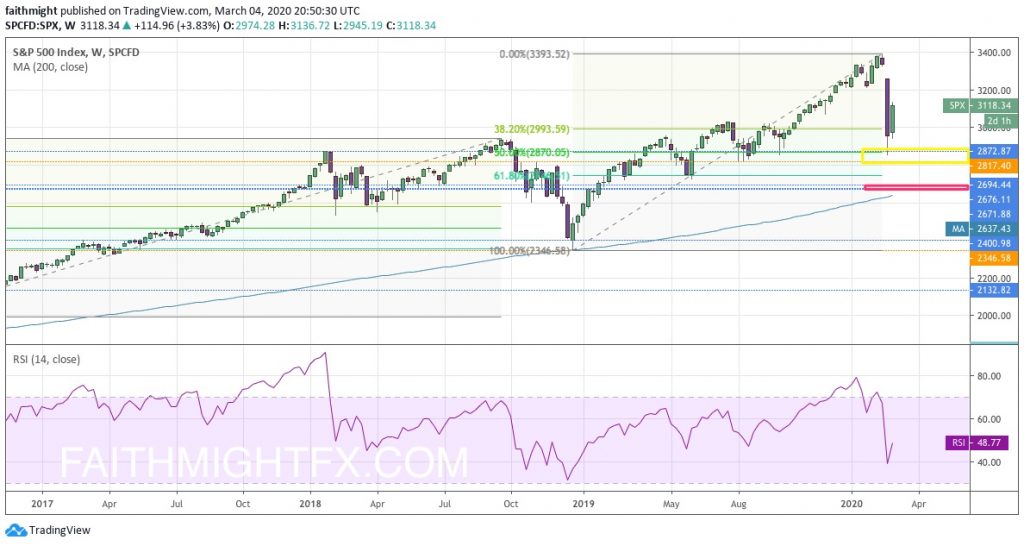
When 30-year U.S. Treasury bonds (expressed in $TLT) made new all-time highs, the Fed had slashed interest rates 150 bps in 3 weeks and put the market on notice with brand new lending facilities and unprecedented QE. Since then, markets have been digesting this newly deployed medicine to the financial tremors of a public health crisis. This digestion hasn’t been pretty for U.S. Treasuries. $TLT corrected lower and then settled into a trading range in the month of May. While price is still in a correction, there are some technical and fundamental alignments that make a bear case for bonds.

TLT WEEKLY CHART

1. The failed high on the corrective bounce with new lows.

A deep correction immediately followed the blowoff rally in April. That correction moved price right into the 61.8% Fibonacci level. So this rally back above the 160.00 level is fairly impressive. It’s been fueled by QE and interest rate cuts along with a commitment to indefinite monetary policy of the most extreme measures from Federal Reserve Chairman Powell just last week. However, all of that has not moved price to new highs. In fact, the failed high signals price moves below that correction low at 139.01. That’s over 20 points lower than today’s 163.59 closing price.

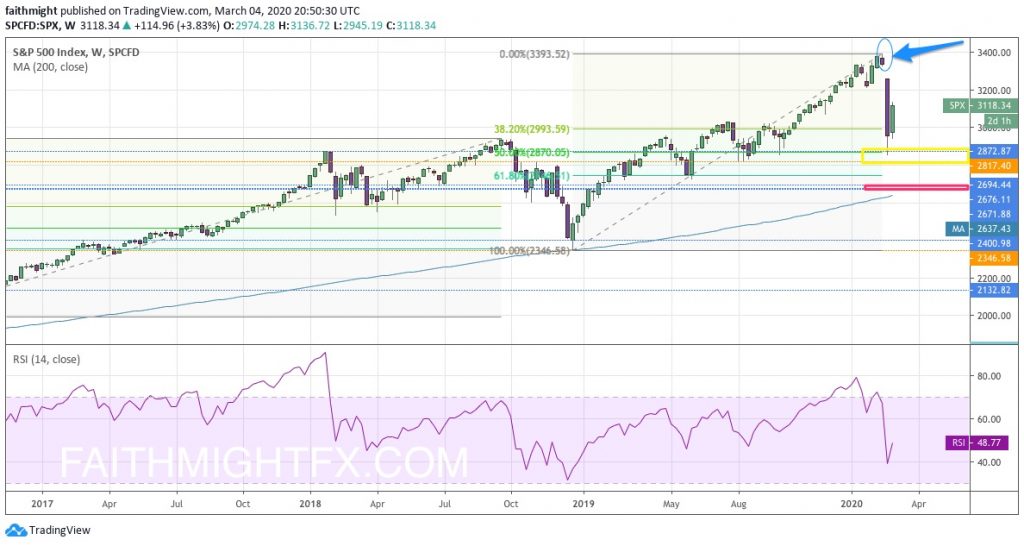
2. The bearish divergence in RSI

The RSI on the weekly chart is showing a divergence with price at the notable all-time high. Subsequent momentum since then has been diminishing and, today, has broken lower to with a close at new lows since the beginning of March. Even as price recovered in March and April, the RSI continued to put in lower highs along with the lower highs in price which is confirming price action. First the divergence bearish signal. Then the weakening strength to confirm that more sellers are entering the market (or perhaps that more buyers are exiting).

3. The geopolitical risk is quietly escalating between the U.S. and China

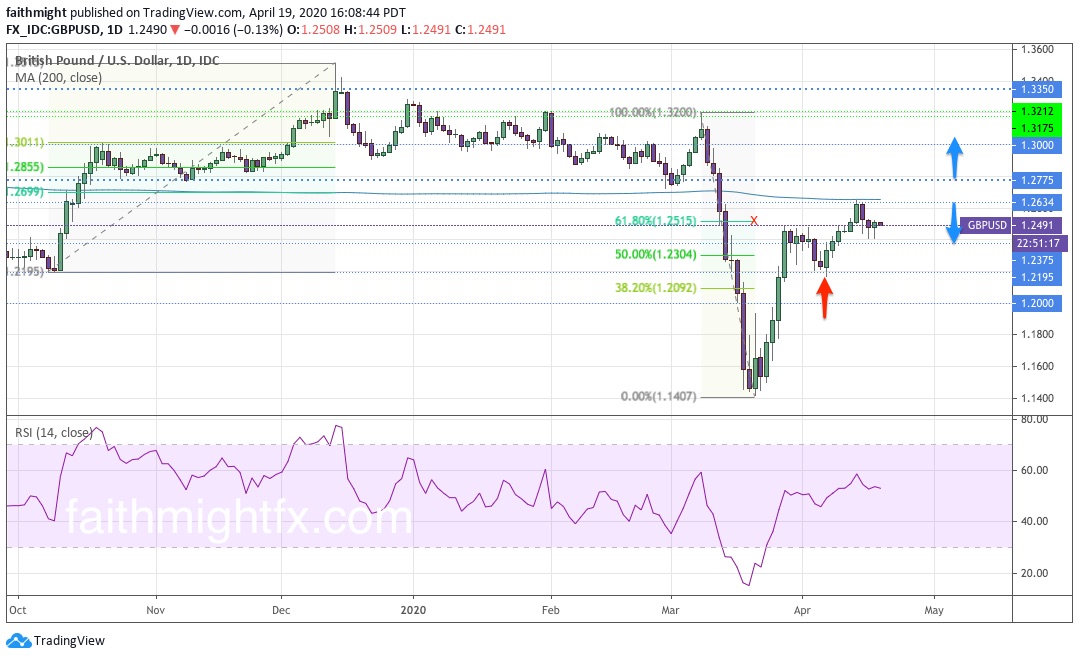
What would be a real reason for bonds to sell off though? Well what about when the largest holder of long-term bonds decides they rather hold another asset instead? While the war of words may have ceased at the end of last year, China has allowed its currency, which it held in tight control, to devalue this year. In the second half of 2019, the $USDCHY first moved above the coveted 7.00 resistance level for the first time since 2008. When it seemed like the U.S. and China had come to some agreement, the $USDCHY dropped back below 7.00. Since tensions have warmed back up as COVID-19 ravished the United States, the $USDCNY has moved back above the 7.00 resistance level with fresh bullish momentum. It is expected that the Chinese government would be quite comfortable with allowing market forces to take its currency even lower.

All that and the situation in Hong Kong makes things even more worrisome. With mainland China changing the laws last minute this week, watch how markets react to Hong Kong, basically, get taken back over by China. This is a huge deal for financial markets and a big signal from China that don’t feel the need to participate in free markets for its long-term growth plans. So does it really need all those U.S. Treasury bonds now too? Interesting times…

[UPDATE] 4. The Fed

My fellow lady trader, @NicTrades, summed it up best.

We can’t both be wrong. Can we? 😉

Read more:


If you are interested in learning how I found these levels, please check out the CHARTS101 course. Read the charts for yourself so you can trade what you see and not what I think.

THE TRADERS SUMMIT

When my friends at Forex Analytix asked me to join their amazing speakers line up, I was thrilled. I was honored to join the event on April 30, 2020 and speak with new traders, in particular, about how to be successful in the forex market and help all traders with some insights on the GBP. Watch the replay of my presentation below and find the entire 2-day event on their Youtube page.

Tesla Trying Again for New All Time Highs

Back in January, Bay Street opened a new position in $TSLA at around $496 for its Lens of History fund. It had just made a new all-time high at the time. I didn’t like the price because I personally prefer to enter on a correction but making new all-time highs tends to be a rare exception to this rule. $TSLA went on to skyrocket to more all-time highs running all the way up to $968.99 in just 6 weeks.

TSLA WEEKLY CHART

Looking at the RSI, $TSLA was extremely overbought that entire 6-week run up. Then the coronavirus hit the United States and spooked U.S. equity markets sparking a selloff in everything. Not even $TSLA was not spared. But what is interesting is that while the correction in price was a very deep one, just past the 68.1% Fibonacci level, the correction in the RSI was not. Momentum never stayed bearish even in the midst of that vicious selloff in price.

Since finding a bottom at the support zone between $360.60-$384.25, price has rallied quite nicely signaling a move back to new highs. However, next week on the 29th, Tesla will be reporting first quarter earnings after the market close. We will be watching that report closely for future direction in price from here.


If you are interested in learning how I found these levels, please check out the CHARTS101 or CHART201 course. Read the charts for your Self so you can trade what you see and not what I think.

Crude Oil Markets CRASH HARD TODAY

When oil markets crashed to $26.05 in 2015, it was the first time in my career that I had ever seen crude oil that low. It didn’t take long for prices to rally and put in what looked like a bottom. But when price didn’t retake the $100-handle 2 years later, I drew the Fibonacci retracement levels to see that the rally was actually only a correction! So I drew the Fibonacci extension levels to see where price could actually target if prices continued lower. I NEVER THOUGHT it would reach that 123% level at $5.78. NEVER. EVER. Today, we are in Never Never Land everybody wow.

So can oil prices really go negative? Because at this rate, $0 is not looking like support. And the next target is -$28.41. What a time to be alive.

[UPDATE, 4:24PM PST] Crude oil prices went negative hitting a low of -$40.32 and closed the trading day at -$37.63. UNBELIEVABLE!


If you are interested in learning how I found these levels, please check out the CHARTS101 or CHART201 course. Read the charts for your Self so you can trade what you see and not what I think.

USD Finally Catching Up with The Fed

With the entire world in full-blown pandemic, the Federal Reserve has gone above and beyond any other central bank in the world in response to COVID-19. To recap:

  • On March 3rd, the Fed surprised markets with an emergency interest rate cut of 50 basis points
  • On March 12th, the Fed restarted quantitative easing with QE5 injecting $1.5T into the repo markets
  • On March 15th, just 3 days later, the Fed slashed interest rates to 0% (effectively but 0-0.25% technically) and cut the discount rate by 50 more basis points
  • These aforementioned actions all occurred outside of the regularly scheduled FOMC meeting that was to be held on March 18th, which was cancelled
  • On March 23rd, a week later, opened up QE even more to include ETFs, corporate bonds and an first-time ever lending facility to retail banks for Main Street lending

But what happened to the USD while the Fed was enacting massive unprecedented monetary easing? It strengthened! It may seem incredulous that a currency would rally in the midst of such large injections of liquidity but forex traders can’t ignore the interconnectedness of global markets.

GBPUSD with SPX on the daily chart
Each Fed easing event is circled on the chart

The real reason why the USD rallied in the face of massive monetary easing was due to the vicious selloff in U.S. equities that sparked a global demand for U.S. dollars. Looking at this $GBPUSD daily chart with the $SPX (orange line) overlaid, we can see that the surprise rate cut on March 3rd was met with the expected market response. Market participants sold the USD in the face of what was more aggressive easing action than expected (25bps cut), sooner than expected (at the scheduled March 18th meeting). But as the coronavirus ripped through Europe and reached America’s shores, investors become thoroughly spooked and began selling equities en masse. Therefore each subsequent Fed action only incited more fear thus making equities selloff harder and the USD rally all the more.

The only thing that finally comforted investors was the passage of the CARES Act, America’s multi-trillion dollar stimulus package. Since its passage, we have seen equity markets stabilize and find a (initial) bottom. And with that, the USD has finally got hip to the fact that the Fed has done what was previously unthinkable in America: 0% interest rates, trillions of dollars in liquidity, and the buying of corporate bonds and ETFs. Unbelievable.

GBPUSD DAILY CHART

The recent USD selloff has seen the $GBPUSD rally break the 61.8% Fibonacci level of cable’s recent descent. This signals a return to the 1.3212 resistance level. However, there a is significant resistance level that must be overcome at 1.2775. And we now are entering earnings season. I think the reaction in equities could be isolated to individual names but will still have an effect on USD demand. Watch for a correction lower in $GBPUSD but, ultimately, cable returns to the 1.3000 level.

Read more:

  • The Federal Reserve just pledged asset purchases with no limit to support markets (CNBC)
  • Traders Rev Up Bets on Who’s Next After Fed’s Emergency Cut (Bloomberg)
  • How the CARES Act Impacts your 401k (FaithmightFX)

If you are interested in learning how I found these levels, please check out CHARTS101 or CHART201 course. Read the charts for your Self so you can invest what you see and not what I think.

When your company has dual citizenship

It’s been a week since the CARES Act became law. By then every stakeholder of business, from accountants to lawyers from investors to bankers, have held webinars and written blogs to how a company can take advantage of the covid19 stimulus package. While my initial thoughts were based in truth, I have learned a lot more strategy this week.

So I contend that my original thought still stands: African startups domiciled in the U.S. are eligible to get this money and they should.

The SBA Disaster Loan, also called the “Economic Injury Disaster Loan,” is a newly-streamlined version of the former disaster loan. It is an online application that has been radically simplified at https://covid19relief.sba.gov. It can be completed in about 20 minutes. An important feature of the SBA Disaster Loan is that it comes with a $10,000 cash advance grant, which can be sent to your bank account in three days. The loan itself is a 3.75% interest rate with long term repayment, or 2.75% for nonprofits. There are no fees or prepayment penalties, and the amount of the loan can be changed after submitting your application. This fund comes straight from the U.S. Treasury; we encourage impacted businesses, nonprofits and independent contractors to apply.

I encourage every founder to apply for the EIDL loan to receive the cash advance.

As for the other loan programs, it will highly depend on who is on your cap table as to whether or not you get disqualified from those programs. So if you’ve done a Series A or B round, there’s an affiliation clause that actually makes large VCs a disqualifier to the IRS. Talk to your lawyers and investors. You pay a good amount of money to maintain filings in multiple countries. You may as well let it work for you!

I shared links to my sources with my email readers, clients and founders, this week. If you want the links that informed my thoughts in this post, get on my email list!

How the CARES Act Impacts your 401k

On Friday, March 27, 2020, after debating and politicking for a week, Congress passed the Coronavirus Aid, Relief and Economic Security Act. The president signed it on Saturday. There are 2 sections dedicated to exemptions for individuals with an employer retirement plan or an individual retirement plan (IRA). From here on, the term, “retirement plan”, only refers to the aforementioned plan types.

CARES ACT IS LAW

The exemptions for funds held in a retirement plan are found in Sections 2202 & 2203 of the CARES Act. If you want the bullet point changes in plain English, SIGN UP above to join our email list. Our readers on the list already have them.

At first glance, there are 2 things great about this. Now, anyone has the ability essentially draw loans on their retirement. Before the bill, you could only draw a loan from a current employer’s retirement plan, leaving capital trapped for young people who have old retirement plans. Secondly, if done right, consolidating old retirement plans now allows you to pay off the distribution without cash out your pocket.

Just keep in mind that these “withdrawals” are actually penalty-free, interest-free LOANS. This money must be paid back.  And, so far, without consequence. It is not explicitly stated what happens when this money is not paid back within the 3-year period. My guess is that you will pay the deferred early withdrawal penalty. But that’s only a guess. I’d watch for Congress to shore that up in a month from now when the Congress comes back from recess. Not sure why they are going on recess in the middle of a pandemic but that’s an entirely different conversation. Hopefully, they are using technology to do virtual town halls with constituents to find out how the next bill can be more impactful for the people and businesses that really need the financial help. 

Consider these exemptions to access to your capital carefully. Since every situation is unique. If you’d like to speak with someone to plan this out accordingly for you, reach out to me and the team at Bay Street.


Read more:

  • Read the Senate’s full coronavirus aid package bill (NPR)
  • Pelosi Begins Drawing Up Next Stimulus With More Aid for States (Bloomberg)

Original image credit

How the CARES Act Impacts your African Startup

On Friday, March 27, 2020, after debating and politicking for a week, Congress passed the Coronavirus Aid, Relief and Economic Security Act. The president signed it on Saturday. There are plenty of provisions in this bill designed to help small business owners, which includes startup founders.

As of today, 29 March 2020

If you are a founder of an African or Latin American startup that is domiciled in the US, you should also examine the new law to see how your company can be eligible for a grant or loan depending on how COVID-19 was impacted your business. You and your tax preparer or company accountant (or both) should look through the bill and discuss any advantages the company can qualify for. Then carefully assess whether it makes sense for your business. Remember to heavily consider your current and future cash flow so that you are able to service any debt in a timely fashion. Debt can be helpful to bridge expenses to the next fundraising round, the next big client or until your target market comes back online to full business and able to pay you again.

Your investors can help with advise here or as a sounding board. They may be able to connect you to professionals you need without incurring costs. Lean on them during this time. We really do want to be of help to you in any way. Reach out to your investors even if you haven’t heard from them. Remember, they are also adjusting to quarantine life regardless of where they may be based in the world. Show us some grace as you hope they show you.

Ultimately, this season will test us all to lead with compassion and creativity. Both founders and investors alike will be remembered for how they were treated during this time. Be kind and super helpful, with healthy boundaries. We get through this stronger than ever.

Source:

Read the Senate’s full coronavirus aid package bill (NPR)

What Did I Say?

Well, so much for the market correcting 20%. I guess it is all in the timeframe you are using to describe last week’s price action. The $SPX dropped last week, 7 trading days in a row to be exact, to correct over 50% off the all-time highs, measuring from the bottom of the December 2018 market crash. This is what the market looked like last week before the Friday close.

SPX WEEKLY AS OF 27FEB20
Maybe it bottoms in the Fibs, but I would’ve given this market to the pink zone.

This is what it looks like after, the new trading week is underway.

SPX WEEKLY AS OF 04MAR20

Two weeks ago, I was on the air with Dale and he asked me what I thought about the coronavirus. I told him that I thought the market would in fact turn lower and it would be a buy-the-dip opportunity. I also got too confident and laughingly said that I just caused the top. Well, this is where we were when Dale and I chatted.

SPX WEEKLY CHART AS OF 04MAR20

Was it something I said? Of course not! It was just my luck that markets would finally react to the news of the coronavirus pandemic into Italy, Iran and the U.S. and the possible economic implications therein. As any technician would say (and I am not one), this is a healthy correction. The 50% Fibonacci level is a solid correction in any market. Now what would really frighten investors is if this bounce this week proves itself to be a dead cat bounce. That actually happened in that aforementioned December 2018 crash. To me, a move above 3200 in the $SPX really begins to signal that sellers have really cleared out of this market. Until then, we should remain cautious.


If you are interested in learning how I found these levels, please check out the course, CHARTS101. Read the charts for your Self so you can invest what you see and not what I think.