fbpx

GBPUSD Update: Maintain Perspective

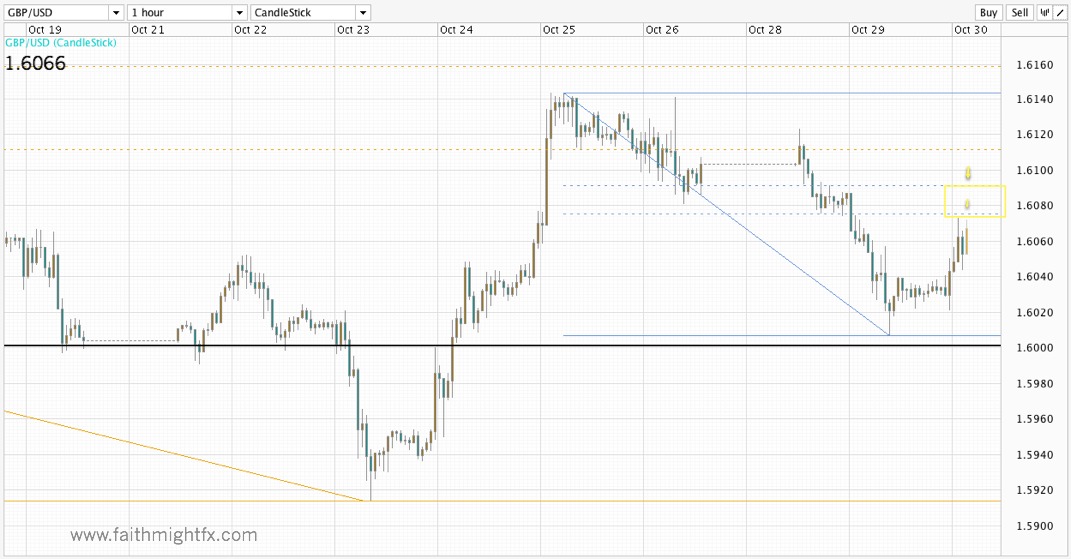
GBPUSD 60 minute chart

I woke up this morning to commentary on the streams saying that risk is ripping higher this morning. Naturally, I checked on the $GBPUSD currency pair to find it rallying off yesterday’s lows near 1.60. It is always good to keep some perspective so I checked the Fibonacci levels and have concluded the following:

This is not a rally. This is merely a corrective bounce in the $GBPUSD. Until price gets back above 1.61 (and closes above the level), the bigger picture still remains intact. Always keep perspective.

Disclosure: Still short.

Sterling Digest, October 29, 2012: Stocktoberfest

In short, I needed to be at Stocktoberfest. Just the exposure to the ideas and wisdom of brilliant, seasoned people always jumpstarts motivation and passion. But the actual in-person connecting with the folks who came to Stocktoberfest was truly inspiring and encouraging for me, a young lady in her career in this industry. Today’s Digest is dedicated to archiving all the reflections and insights that is Stocktoberfest 2012. I was honored to be there. See you all next year!


GBPUSD Reckons

GBPUSD daily chart

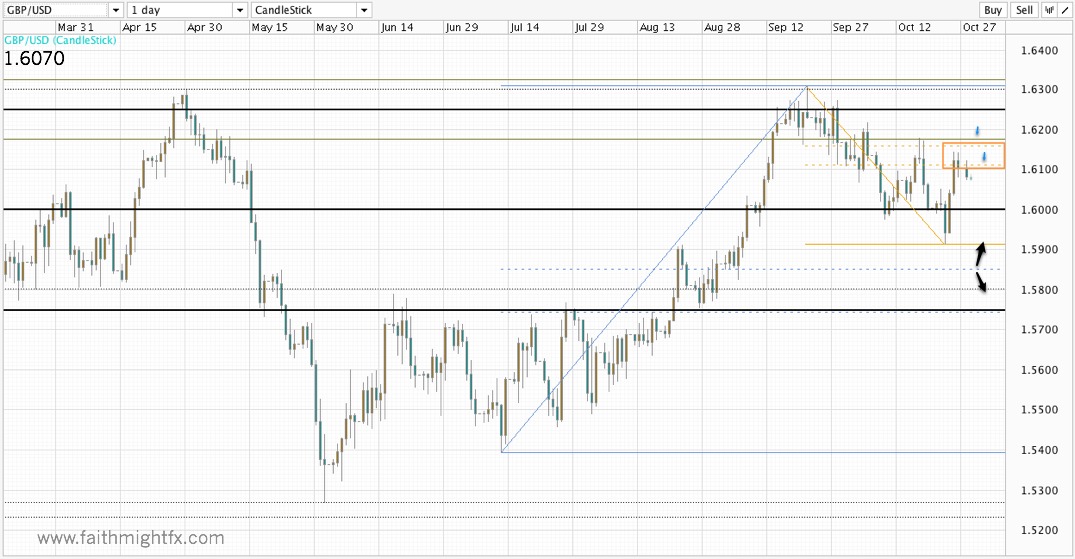
With the 61.8% Fibonacci level being respected, $GBPUSD looks ready to head back to the bottom of its down channel as London opens the new week. Watch $GBPUSD test and break 1.60 on its way to new lows at 1.5850, the 50% Fibonacci level of the summer breakout of 2012.

Furthermore, the USD moves could actually dominate flows as US events risk increases in this last week before the election and NFP Friday. Nevermind Sandy and a docket full of economic releases heading into the jobs report. In contrast, the UK has a very light calendar with only 2 PMI numbers released this week. It seems a very good week for the USD to strengthen significantly against sterling. Could this be the week of reckoning for cable?

Disclosure: Short at 1.6068

Are Euro Bulls Back?

EURGBP daily chart

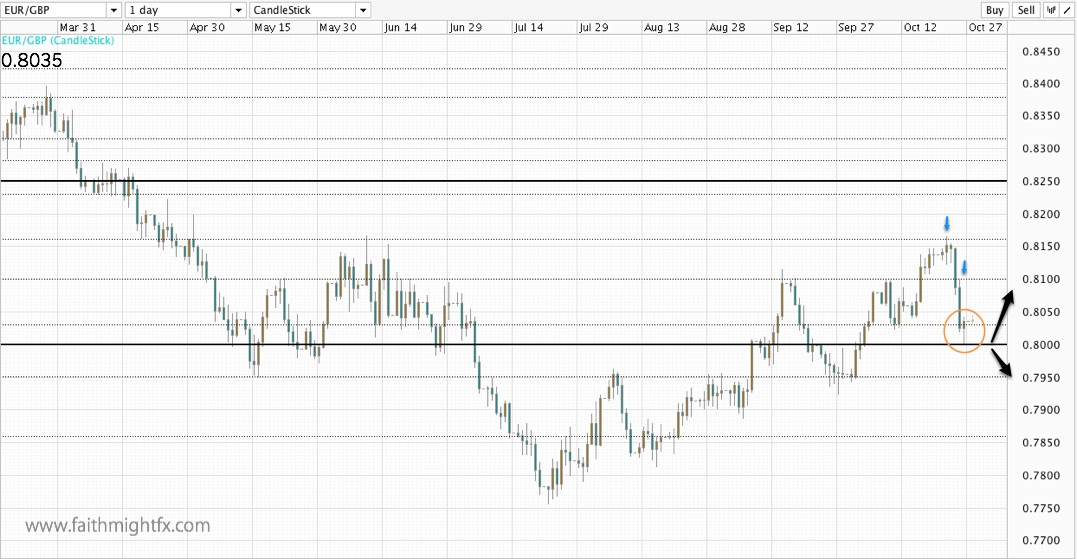
As the market closed Friday trading, $EURGBP encouraged bulls with a close above the 0.80 major psychological level. The close above 0.8030, however, should give bulls even more confidence into this week’s open. As a major support/resistance level, we see the influence a candle close above 0.8030 can have, even more so than the whole number.

I’m still not a fan of a long euro position. But the recent high at 0.8160 is a new high. We have higher lows on the daily chart here. And my friend JC has been bullish the euro ($EURUSD) for some time now. It now looks to me that euro long is the path of least resistance.

Disclosure: Closed shorts at 0.8032 for +56.8 pips.

Cable Runs Higher

Now with FOMC behind it, this week’s market open in $GBPUSD was deja vu. Remember when cable closed above 1.60 for the first time in 5 months? The new market opened chopping around 1.60 before breaking higher to 1.6250. We have the same price action as price now chops around 1.6250.

But not everyone believes in this trend. There are a lot of bears out there.


That’s an incredible statistic in the face of a 500-plus-pip rally. It makes me shake my head to the fact that this pair could run higher just on sheer unwinding of losing positions. Many of these bears point to the sterling’s own weak fundamentals. But the fact is the BoE’s on-hold (for now) monetary stance is much more hawkish than unlimited QE. The very notion of unlimited money printing is ridiculous. QE-infinity is rightfully killing the USD. Even QE3-backed pounds are more attractive at this point. As such, I think that the $GBPUSD can still run higher. Technically, it has given nothing but bullish signals since breaking and holding above 1.58.


As cable opens the week chopping around 1.6250, it works off its overbought nature without retracement. While I do agree that $GBPUSD is overdue for a pullback, we cannot overlook the power a trend. Don’t mistake this chop as a bearish signal. Trends are powerful. I believe this one has just gotten started.
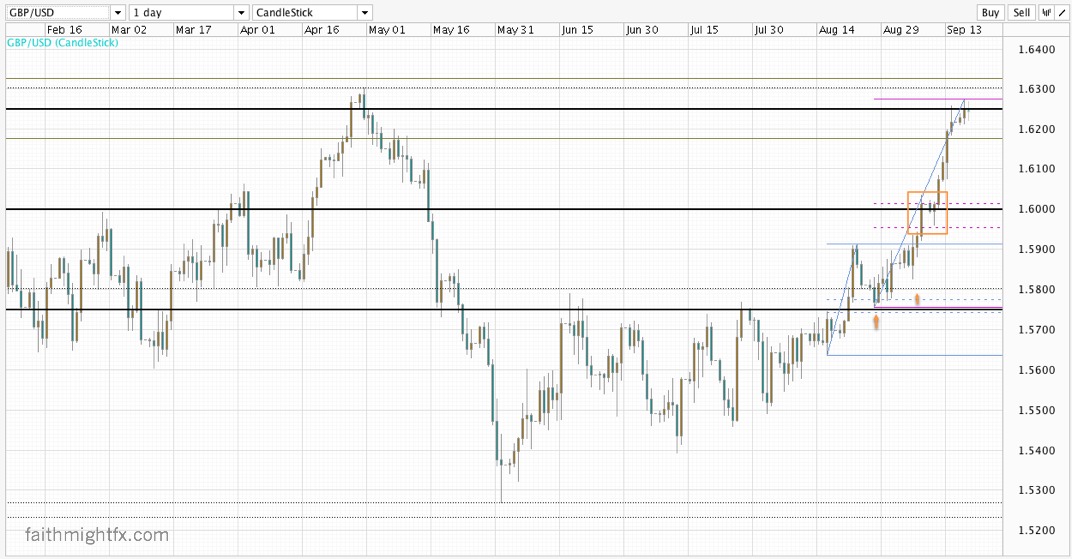
GBPUSD DAILY CHART

With 1.63 resistance looming not too far ahead (price at 1.6240 as of this writing), time your entries well. Even a pullback to 1.60 doesn’t change the bullish outlook short term. Trade what you see.

Aussie and Kiwi Diverge

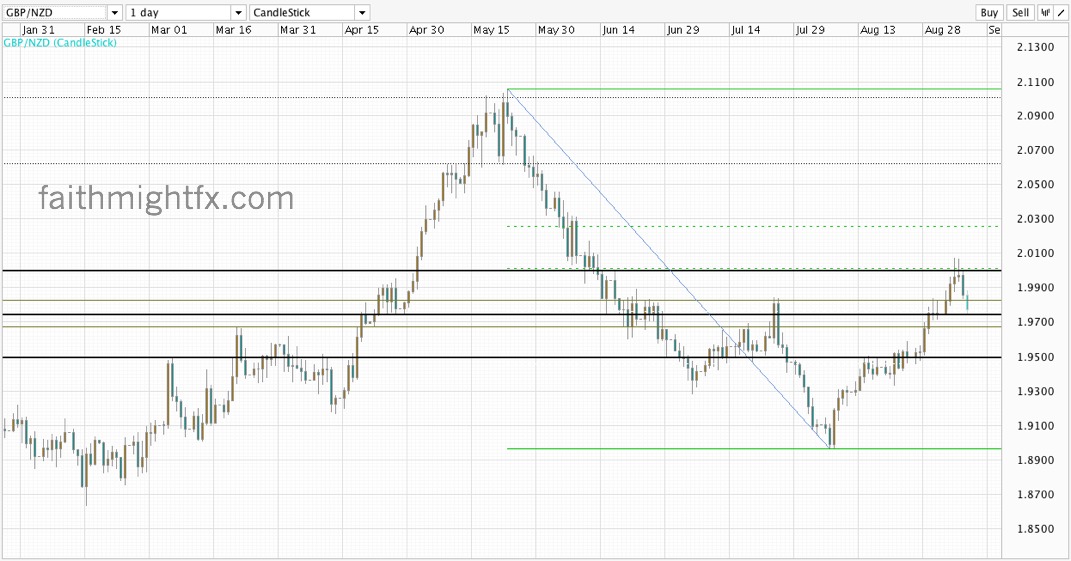
The New Zealand dollar weakened for a month and rallied the $GBPNZD to the big time 2.00 psychological level. Despite the breakout higher to 2.0050, price formed a double top at this level. Earlier this week, I stated my wariness with this sterling rally versus NZD. Kiwi fundamentals looked good on this rally. In fact, this impressive looking $GBPNZD rally was only a correction. With the 50% Fibonacci level at 2.00 holding, this pullback could make its way to new lows. Today’s break below 1.9750 signals a move lower still to 1.9500.

GBPNZD daily chart

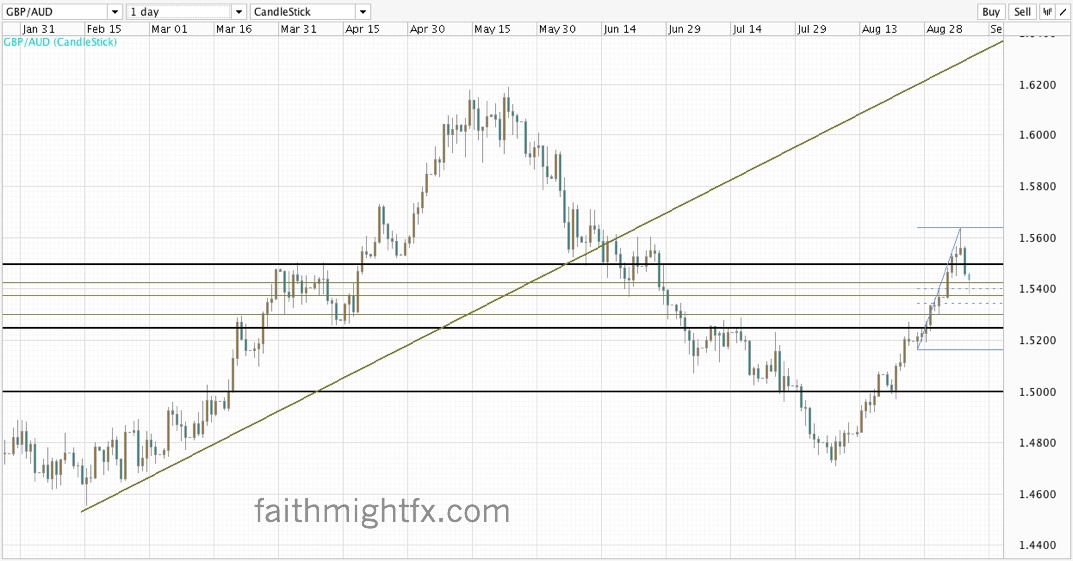
In contract, the Australian dollar is still fundamentally weak. Iron ore and copper prices are still at low levels. The global economy is still slowing. This sudden wave of bullishness didn’t change those things. The recent $GBPAUD rally was a breakout not a correction like the $GBPNZD. To me, this wk’s rally in AUD is just a correction. Now we are starting to see this divergence in fundamentals play out versus the GBP. This may only be the beginning. Trade what you see.

GBPAUD DAILY


Disclosure: Short $GBPNZD


The Quiet Kiwi

The NZD trades in the shadow of the almighty AUD and the more familiar CAD thanks to its proximity to the US. While the NZD is a commodity play, it is not a play on energy like the AUD and CAD, but on foods like dairy and cattle. Even as inflation has edged lower in many countries, food prices remain stubbornly high. The high prices in these and other agricultural commodities have gripped the NZD in a bull rally for much of 2012.

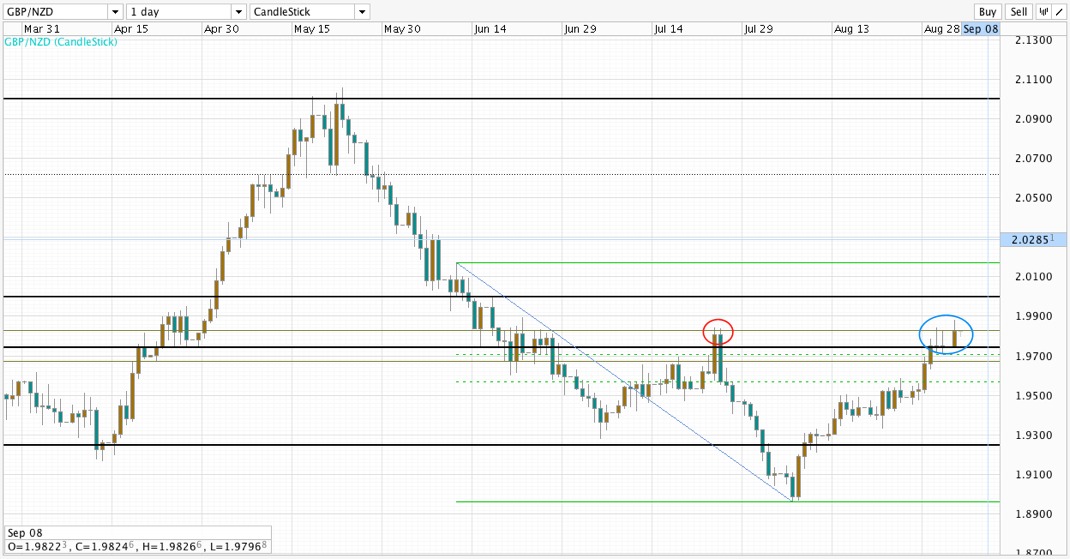
The $GBPNZD enjoyed an incredible rally in the 1st half of the year. So it seemed natural that a pullback occurred off the key resistance level of 2.10. But when the $GBPNZD broke below the major psychological level at 2.00, price broke down to new lows at 1.47. Since that low, price has marched higher. Last week, price staged a breakout above the previous high at 1.9825.

GBPNZD DAILY

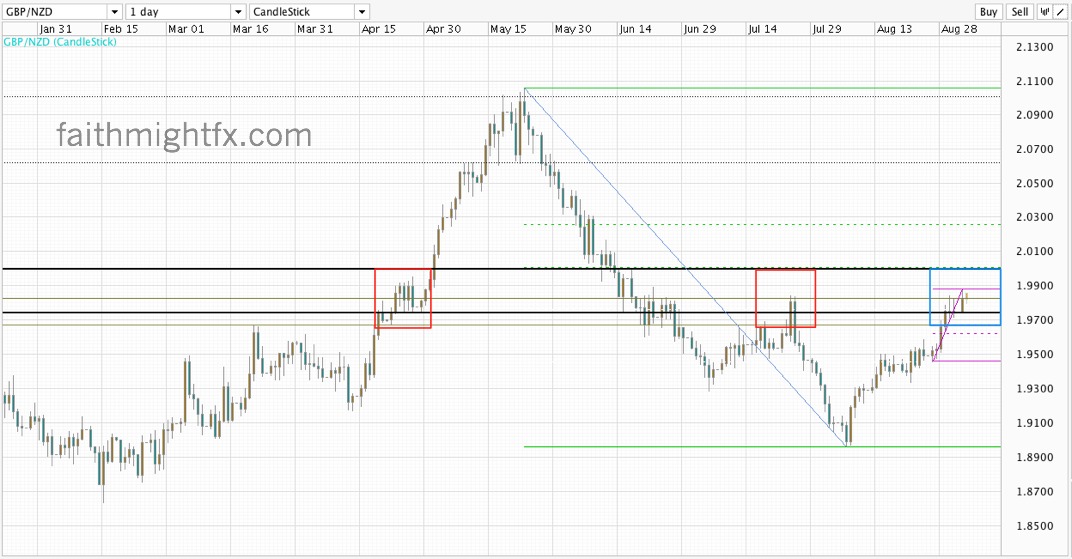
The new week open has seen price gap higher to a high of 1.9880. The pair is firmly bullish to open the new week. The key level this week is 1.9750. If $GBPNZD remains supported above 1.9750, price targets a move above 2.00. A close below 1.9750 sees price move lower below 1.95. Because the fundamentals still look strong, it will be interesting how price behaves at the 2.00 level which is also the 50% Fibonacci level of the entire breakdown. Trade what you see.

GBPNZD DAILY WITH BIG FIB


Disclosure: No position

Aussie Bears

AUD bulls have enjoyed quite a rally since May 2012. However surprising to me, the market has determined that the AUD will no longer benefit from high-priced commodities due to a slowdown in demand. This sagging demand has begun to weaken prices.  We find this evidence as over the past several months we have seen inflation tick down in many countries. David Bassanese writes that,

the mining boom is not over, to be sure, but its contribution to growth is waning and should go into reverse in around a year’s time…I am also warming to the view that the transition back to the non-mining sectors will need to be aided by much lower official interest rates – potentially another one percentage point cut in the coming year…

GBPAUD DAILY September 2 2012

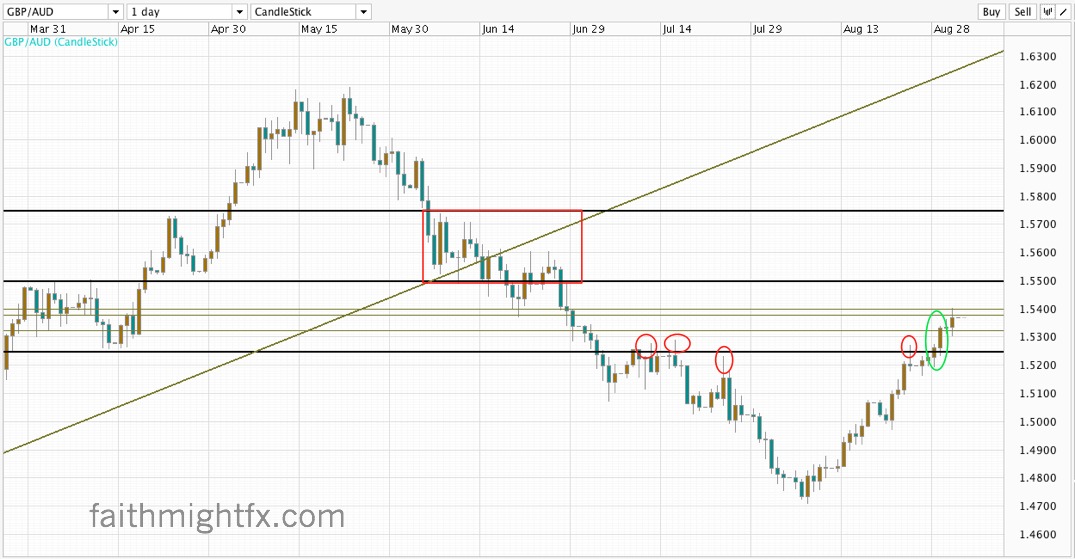
In anticipation of a slowing economy and rate cuts from the RBA, the market has turned decidedly bearish on the Australian dollar. And this is just the beginning of the new trend. Since the bottom at 1.4700 in July, the AUD has weakened tremendously against the GBP as it heads lower across the board. The $AUDUSD and $EURAUD have also breached key levels at 1.05 and 1.20 respectively. Both pairs closed the week well beyond those levels. The $GBPAUD was no different. After serving as key resistance, this week’s break above 1.5250 led to a breakout of over 150 pips. $GBPAUD ended the week well above 1.5250 and remains bullish to open the week. However, price could chop around 1.55. A daily close above 1.5750 targets 1.60. A close below 1.55 targets 1.5250. Trade what you see.

Disclosure: Long $GBPAUD


Cable Closes Bullish

So my 1st full week back in the markets was treated by a long-awaited breakout in the $GBPUSD.

GBPUSD daily August 26 2012

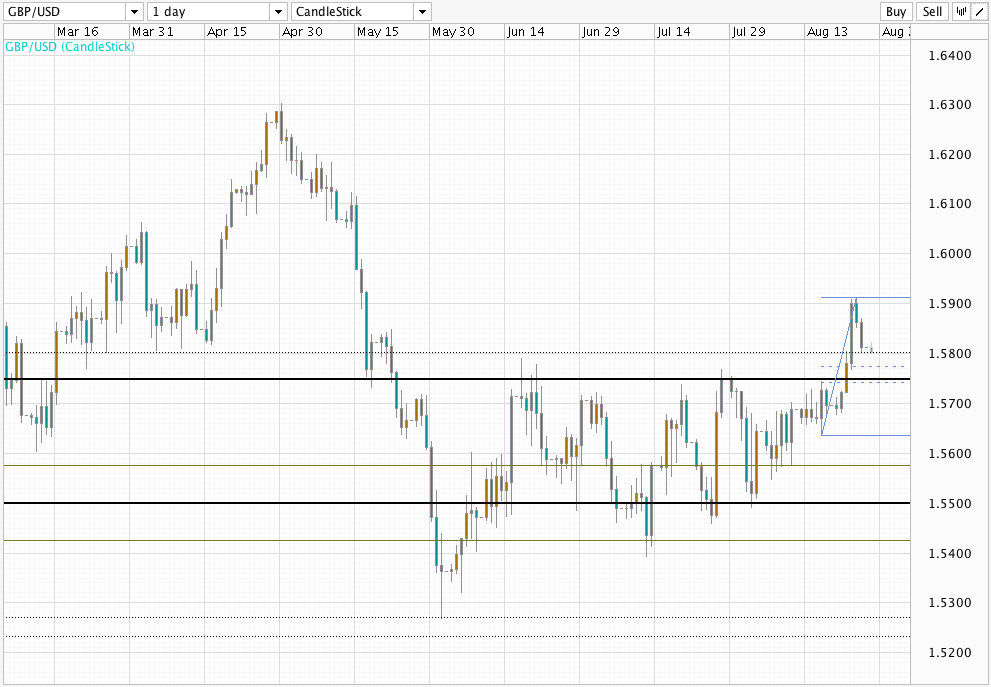
The breakout above 1.58 to 1.5900 still needed confirmation. We have been faked out by cable’s breakouts before. But this week’s breakout actually looks for real.

1. The Fed

The Federal Reserve has been very vocal about adding another round of QE to the markets. The Fed meeting minutes released this week confirmed this. In fact, during Friday’s session, a letter from Bernanke hit the newswires. This letter confirmed and justified more QE from the Fed Chairman himself. QE is always dovish and the USD has taken a hit every time the market anticipates any QE from the Fed. This time is no exception.

2. 1.5800

1.5800 has been a very key level for the past year. Whether price is trading above and finding support or trading below and finding resistance, action around this price level has been historically indicative of further direction. To close the week above 1.5800 is a very bullish technical signal from the $GBPUSD.

Last week, I was very skeptical of cable’s rise. Even as it staged a breakout, sterling’s fundamentals kept me wary. However, now that we have had technical confirmation with this bullish weekly close, I trust the charts to support this breakout back towards 1.6000. The only thing that changes this bullish view this week is a daily (or weekly) close below 1.5750. Trade what you see!