fbpx

Netflix’s Price Has Been Consolidating

The first half of 2020 started so well for Netflix investors as the price remained bullish. The lockdown must have aided the bull run as many countries were on lockdown, getting on Netflix was one of the ways to maximize the lockdown. Before the lockdown, between January 2018 and January 2020, the price of $NFLX was ranging between $228.51 and $421.60. But in May 2020, a breakout to the upside occurred as price brokeout the then $421.60 resistance level. The highest price level $NFLX reached this year was at $591.89, resulting in major resistance. The resistance level at $591.89 was last reached in July 2015 when $NFLX had a stock split at 7 for 1, as the price moved from $662.25 to $110.69.

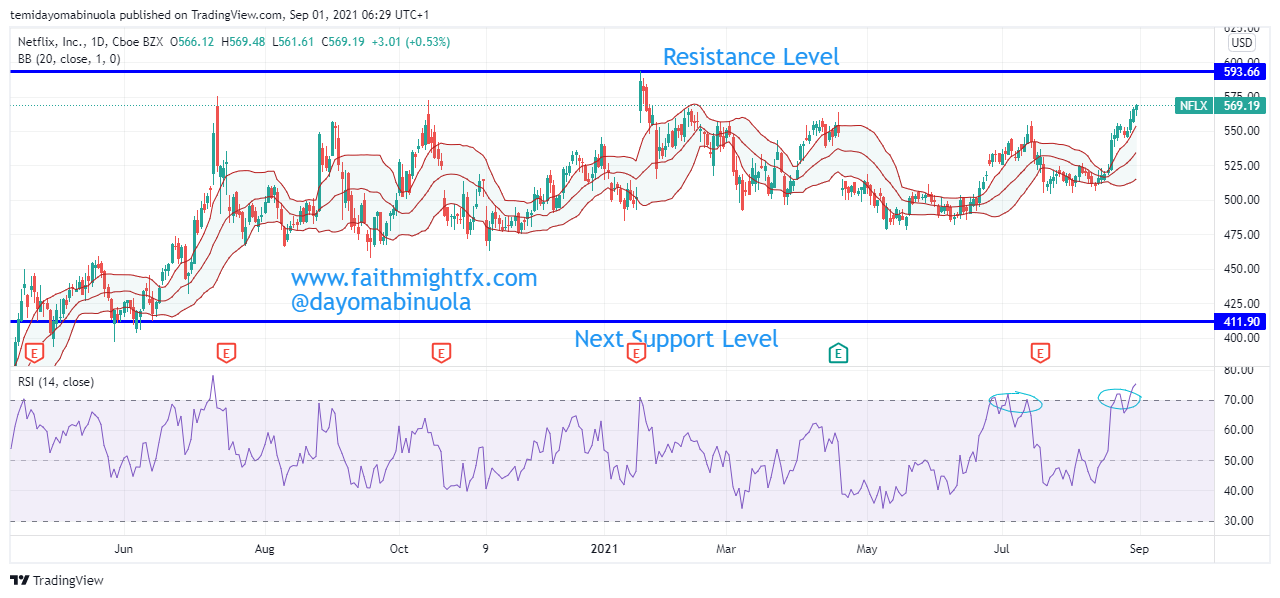
A head and shoulder pattern is being formed as price retraces back to $569.19. RSI has indicated at two different times of price being overbought between July and August 2021. A reversal might occur, which might result in a sell-off. $NFLX might lose about 160points from the current price at $569.19. Price is currently maintaining the upper region of the Bollinger bands. This year’s support stands at $479.57. As sell-off begins to occur, the year’s gain might be wiped out, as the price might reverse to $409.96.

Goldman Share Price Might Drop

Goldman Sachs’s share price reached an all-time high at $418.27 on the 12th of August, that’s about two weeks ago. This could have happened as a result of $GS’s deal with Fiserv. Towards the last week in July 2021, Goldman Sachs boosted the transaction banking business with the Fiserv tie-up. This innovation has attracted more than 250 clients, which was over $35billion in deposits and trillions of dollars in the system since June. The all-time high of $GS in June was at $392.71.

Just recently, Goldman Sachs demands proof of vaccine status for US office entry. This may not go well with some clients as there are many controversies around the administered vaccine. The return-to-work policy is accompanied by mandatory once-a-week testing for employees and enforced mask-wearing in shared office spaces to contain the rapid spread of the Delta variant in the US.

In August, $GS had the most recent all-time high at $418.27, after which the price began to fall, there was a retracement that brought the price to $416.69 just yesterday. Indications are showing of a possible reversal, which might be due to the new work policy in $GS, for the mandatory vaccine for both staff and visitors. A drop in price might occur, which might bring the price to $361.95.  This might be unfavorable for $GS investors. The new work policy might not stand as there are rising cases of vaccinated persons contracting covid again. RSI has shown since May the price being overbought at three different instances.

EURUSD Tries to Break Support Level

In May 2018, a EURUSD dip started as the price fell below 1.16997 and went as low as 1.06394., this was over 1000pips. Later in 2020, The EURUSD bulls pushed the price upward to a new resistance at 1.16997 in July 2020, and in August 2020 it stood as support. The EUR has gained so much against the dollar since after the ease of lockdown in 2020.

In April 2021, EURUSD had a bullish run from a support level at 1.7032 to 1,22651 in the last trading week in May. The bears took over and pushed the price to the support level at 1.7032. There was a fake-out to the downside, price has tried to retrace with three bullish candlesticks in the last 4 trading days. At the beginning of August 2020, the bulls tried to break the minor resistance level at 1.19019 to the upside, but instead, the bears pushed the price lower. As we see the bull power gaining momentum in the past 3 trading days, we might see the price reach the next resistance level at 1.19019. A breakout to the upside might push the price towards the major resistance level at 1.23465.

Between June and July, RSI has revealed 2 oversold positions. This could be an indication of a possible reversal.

SPX Might Lose Its Bullish Strength Temporarily

SPX is an American index based on 500 large companies listed on NYSE and NASDAQ exchanges. Many regard it as a haven. Many of the stocks in the SPX have reached new all-time highs in the last decade. Companies like Apple Inc, Amazon, General Electric, Facebook, Microsoft, Alphabet, Tesla, and many more are listed in the S&P 500. The market capitalization of SPX is valued at $38.2trillion as of June 30, 2021. S&P 500 has been on a long-term bullish trend over the last decade with only a few corrections. The most recent correction occurred during the pandemic, after which price continued the upward movement. The price of SPX in the year 2010 was at $1111.43, SPX’s price today is at $4,448.07, that’s about 4X over the last decade.

The all-time high price of SPX was at $4480.11 on the 16th of August. In April and July of this year, SPX shows that price has been overbought in the two instances. A correction to the downside might occur as stocks are beginning to fall in the past few days due to increasing cases of Covid-19. Price is currently consolidating at the upper region of the Bollinger bands. The next expected support could be at $4,212 i.e.SPX might lose about 300 points in the coming weeks. 

You Might Now Have Gold Or Silver

Most gains in the commodity market in 2021 have been lost. With an emphasis on Gold and Silver, Silver’s price at the beginning of the year at $26.605 per ounce. Price rallied to $30 on the 1st of February, after which a major dip began. Today’s current price of silver at $23.685 was last reached during the lockdown in April 2020. The long time frame shows that price of $XAGUSD might dip in the coming months or years, as RSI shows that price has been overbought.

Could it be that the pandemic might pose a further threat to the commodity market? The last time the commodity market was badly affected was in 2011 after it reached a peak at $50. In 2018, the US Department of Justice (DoJ) had arrested a former long-time precious metal derivative trader from JP Morgan Chase for precious metal fraud. This year’s fall in price might be a result of increasing cases of Covid-19 across the world.  

We might see a rally in the price of Silver in the coming weeks as there was a bounce on the support level at $22.246. All Silver gains in 2021 have been lost with -10.9%. Price is currently at the lower region of the Bollinger bands, but we have an indication on the RSI that the price is oversold. In the last 5 trading days, the price has been consolidating, which could lead to the next bull run to $27.902.

$XAUUSD’s price at the first trading in 2021 was $1902. Buyers made price reach at yearly high at $1959., which was about 3% gain. Gold has lost all the gains this and at a loss of 5x from the initial monthly gain. In April, we wrote of the continuous fall in the price of Gold. . There was an uprise to $1918 from $1778 after the analysis. Nevertheless, after the rally, the price fell to $1740 this month, where the article’s next support level was pointed to.

Many manufacturing countries might have reduced production, which could have been as a result of low patronage caused by Covid-19, hence the reason for the drop in price. Price was initially showing overbought in May, but in June and August, the price of Gold showed the price is oversold. The current price of Gold is at $1779.24, as last week’s trading closed high. This indication could push the price to $1895, renewing hope for the gold investors.  

Dow Jones Fails to Breakout of Resistance

Dow Jones, being the index of the 30 top-performing U.S. companies, has been in range in the past few months, with the all-time high at $35,260. In January 2021, the Dow Jones passed the psychological level at $30,000 for the first time.

IN January 2020, Price tried to reach $30,000 but the bears pushed the price lower. Since March 2020, Dow Jones has been on a bullish run from its then $20,000, that approximately 75%. Prices of many stocks in the US have reached new all-time highs after the pandemic. There have been rising cases of covid-19 across the world, and especially with the USA having an average of over 100,000 new cases per day.

If covid-19 cases cannot be controlled in the next few months despite vaccines being administered, stock prices might begin to fall across the world and lockdown might be re-imposed. The next major support of $DJI could be around $26,900 if the price falls. As the price of $DJI crosses $33,000, RSI indicated that the price has been overbought, though the bulls still pushed the price higher to reach $35,000. The last time RSI showed that price has been overbought, the price of $DJI was below $30,000 which resulted in about a 40% dip in price.

Price still maintained the higher part of the Bollinger bands, though, in June, there was an indication of a reversal in price, as the price fell to $33,100 from $34,900. Companies in Dow Jones with the highest losses in July were Verizon with 5.9%, Walt Disney 2.5%, and Merck 3.1%. If the price of $DJI fails to break the resistance level at $35,260, the price might fall and might be catastrophic for the investors.

CONFESSIONS OF A FUND MANAGER

Yes, it’s true. In the midst of a global pandemic and during shelters in place, I kicked off my efforts to raise a vc fund in May 2020. Because I know the road is long to eventually work with institutional investors, I decided that with folks much more willing to take a video call, the pandemic was a good time, ironically, to forge those relationships. I kept having conversations and those conversations led to multiple meetings. I can no longer say that I hate networking. The pandemic made me love it. I joined Lunchclub, Clubhouse, and 100 Women in Finance. I learned a ton. Now 15 months later, I am doing my first first close! As I reflect on the process to prepare for the second close, I am basking in this milestone. It’s a huge moment in my career but it is an even bigger win for Africa.

Now by 2021, I had been in a lot of meetings by global pandemic standards. One of those meetings was with The Afropreneur himself, Idris Bello. I’ve followed Idris for a long time on Twitter. I knew his work. But I knew his partners, Marsha Wulff and Michael Oluwagbemi, a little bit better. I wanted to make an introduction to LoftyInc and they told me that I needed to speak with Idris. So I did. A couple months later, I find myself in Abuja to meet Michael at the LoftyInc office discussing an opportunity to join them with their new Fund.

Abuja, 2021.

Even though I was born in California, Nigeria was always called home. I always knew that I would invest there. That call has become more possible with FM Capital Group and the small checks we are able to deploy. But LoftyInc is one of the most prolific investors on the continent. They’ve been investing in Africa since 2009. They started one of the first tech hubs in Nigeria, Wennovation Hub in 2011. I did my first investment in Uganda in 2012. The Partners have been together for over 11 years. I’ve been a solopreneur for 6 years now. So when they gave me the opportunity to join a TEAM, and THIS is the team I get to join?!? I literally get to learn from the trailblazers. It was a no-brainer. In fact, it is an honor and a privilege.

I’ve been working with LoftyInc for 4 months now on the LoftyInc Afropreneurs Fund 3. I can’t wait to talk more about it, especially from an operations perspective. What a journey it has been! And this is only the beginning…

Pebble Beach, 2019.

WTI Oil Price Falls Below $70 Again

The WTI Oil Price has maintained its price above $70 since mid-June until the price crossed below $70, reaching $65.24 in July. There have been rising cases of Covid-19 in some countries, which has resulted in some countries going back to lockdown. The Delta Variant of Covid-19 has been reported to be spreading like wildfire.  

$CL’s price peaked this year at $76.91. The last time price of crude oil reached $76.91 was October 2018. The global lockdown in 2020 made the price of Crude Oil fall to negative prices. Could it be that the increasing cases of Covid-19 across the world are responsible for the fall in the price of crude oil? Only time will tell, with some countries are re-entering another phase of lockdown. 

Despite vaccines being administered, many countries are back to lockdown. Full-time jobs lost in 2020 were around 400 million. Many economies are yet to recover from the challenges faced during the lockdown. Palliatives were distributed to citizens in developed countries, while underdeveloped countries faced the reality of life as many people starved. The world cannot afford another lockdown and there might be an increased number of depressed people if another lockdown is introduced globally.

RSI shows 3 different cases where the price of crude oil has been overbought in June 2021. This could be a strong indication of a possible reversal to the strong support level of $57.82. However, this month of August has already started on a bearish note with two bearish daily candlesticks.

MICROSOFT CURRENTLY RANGING AROUND THE ALL-TIME HIGH

In the early trading days in 2018, Microsoft’s share price broke out comfortably above $100. And since then, the price is yet to reverse toward $100. The bull run continued until February 2020 when the price reached $190.82. As at that time, a resistance level was formed around $190.82, which lasted for about 3 months, as the support level was $134.07 in March 2018. This correction was the longest one since 2018, which was about 29.7%. The next rally after the correction has made a price of $MSFT attain $281.11 price.

Over the years, $MSFT has been investing hugely in products with Augmented reality and Virtual reality. These investments could be the major reason for the bullish run in the past few years. The most recent all-time high was reached at $281.11, on the 7th of July. The chart has the majority of higher low and higher highs patterns. Since the beginning of June 2020, RSI has shown many levels where price has been overbought.

A reversal could occur as a gap down and a gap up was shown on the chart when the price was below $250. A higher low might begin, which might push the price lower to reach $262.03. Also, many stocks are currently at the all-time high or ranging around the all-time high.

Google Reached An All-Time High

The share price of google at the beginning of 2021 was $1341.91. The bulls have been pushing the price upwards since March 2020, when the price was at $1021. Since the bullish trend started in March 2020, $GOOG has generated over 152%. There have several all-time highs in the last year. This might lead to a price reversal. Google has new products with augmented reality, this could have been the reason for the continuous bullish movement.  Google is currently at an all-time high of $2574.38, the price might reverse with obvious indications on the chart.

The RSI has shown at least three major levels of the price being overbought since the beginning of the year. On the chart, there was a correction that occurred in May 2021, after which the price rallied to a new all-time high at $2574.38. Price tried to touch the middle Bollinger band line before a continued rally, this could be an indication for a possible reversal in price to a new support level at $2331.24. As we await the $GOOG earnings report on the 29th of July, the candlestick for July might be a bearish one with these indications.