The share price of google at the beginning of 2021 was $1341.91. The bulls have been pushing the price upwards since March 2020, when the price was at $1021. Since the bullish trend started in March 2020, $GOOG has generated over 152%. There have several all-time highs in the last year. This might lead to a price reversal. Google has new products with augmented reality, this could have been the reason for the continuous bullish movement. Google is currently at an all-time high of $2574.38, the price might reverse with obvious indications on the chart.
The RSI has shown at least three major levels of the price being overbought since the beginning of the year. On the chart, there was a correction that occurred in May 2021, after which the price rallied to a new all-time high at $2574.38. Price tried to touch the middle Bollinger band line before a continued rally, this could be an indication for a possible reversal in price to a new support level at $2331.24. As we await the $GOOG earnings report on the 29th of July, the candlestick for July might be a bearish one with these indications.
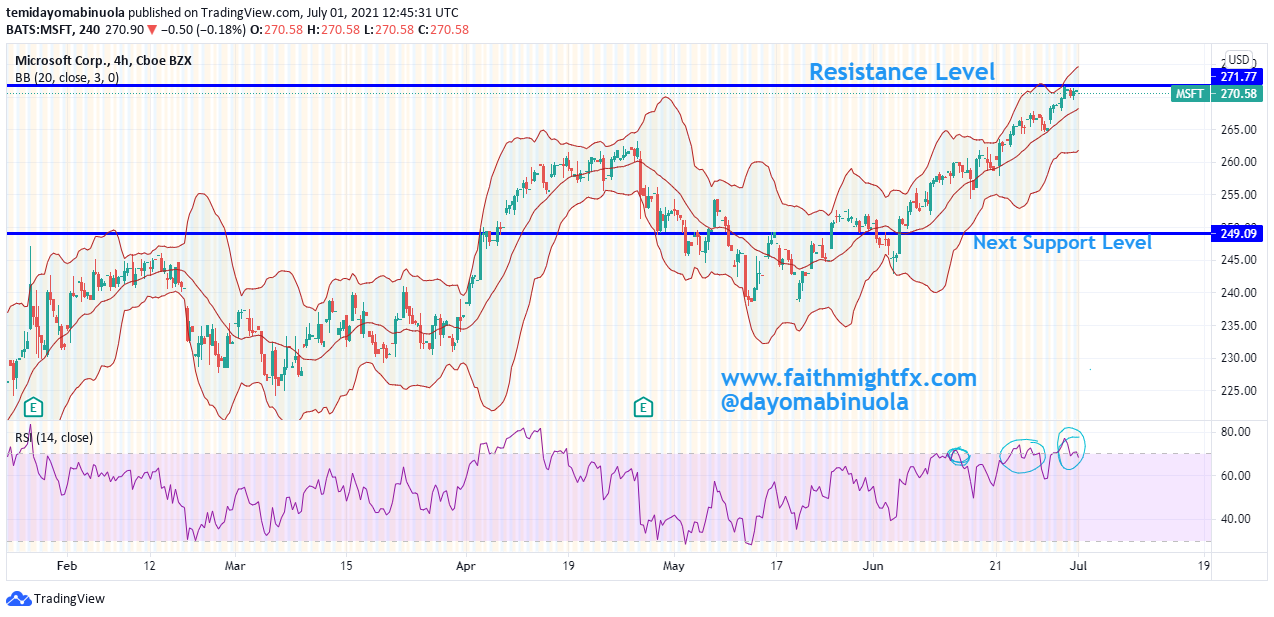
The monthly chart shows that $MSFT has indeed enjoyed a bull run since 2009. That’s about a 2,000% gain in the last 12years. Despite Bill Gate stepping down from being a member of the board at Microsoft, the share price of $MSFT has continued to increase. In March 2020, the month Bill Gate resigned from being a Board member at Microsoft, the share price of $MSFT closed at $157.60, which means the appreciation was about 72%.
In the past, there have been several all-time highs with minimal reversals. The current share price of $MSFT is at an all-time high at $271.77. There are indications showing that there might be a reversal to the downside, to new support at $249.04. That shows that about 9% might be lost from the current price of $MSFT at $271.77.
RSI has shown 3 obvious levels that price has been overbought. In April, the all-time high was at $263.03, after which a correction occurred which made the price reach $238.11. Price is currently at the upper region of the Bollinger bands. In the month of June, the price touched the middle line of the Bollinger Bands two times. This might be an indication of a possible reversal.
Coinbase Global ($COIN), which operates, as a cryptocurrency exchange platform, debuted as a public stock in mid-April. At this time, many cryptocurrencies became even more volatile and saw a significant drop in price. Coinbase was founded in June 2012 by Brian Armstrong, a former Airbnb engineer. Armstrong enrolled in the Y Combinator start-up incubator program and received a $150,000 cash infusion.
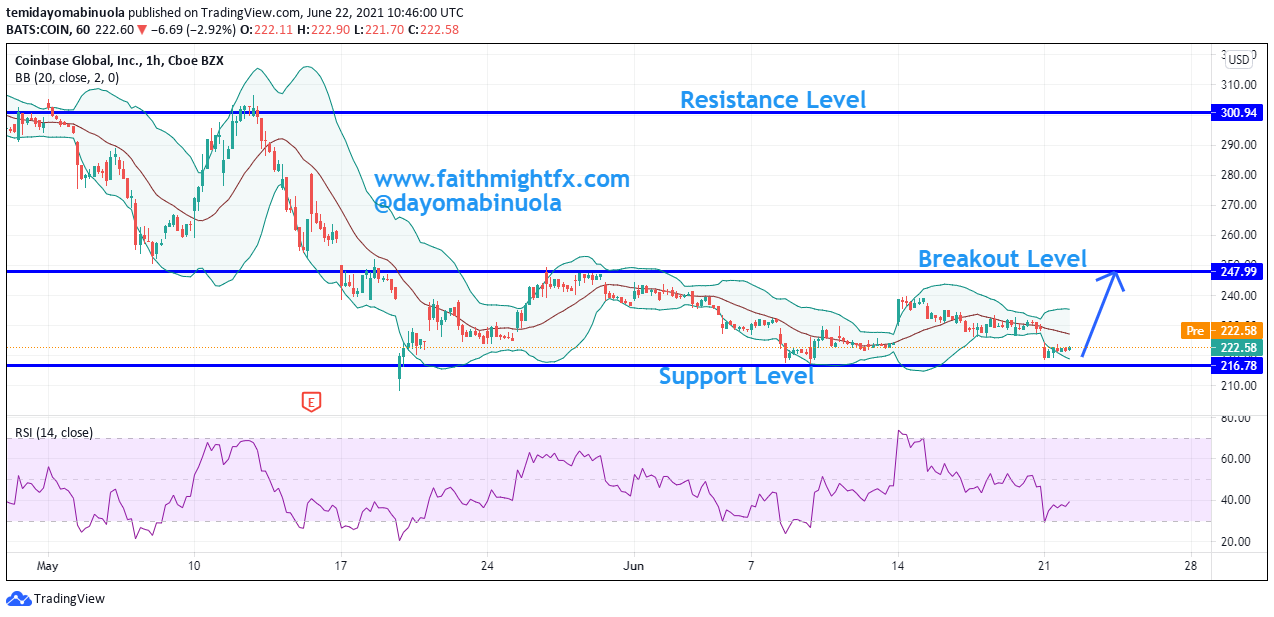
Since the Coinbase stock debuted publicly, it has been on a downtrend. The share price opened at $381, the intraday high was at $429.54, and then traded as low as $310. The current chart of $COIN is just a good representation of lower lows and lower highs since it was listed. The support level has been maintained at $216.78 since mid of May 2021. Since this May, the price has been ranging between $216.78 and $247.99.
On the RSI, there have been many instances of the price being oversold. Price is currently on the lower region of the Bollinger bands. A breakout to the upside at the breakout level line on the chart might push the price to $300. The crackdown on Crypto in China might have caused the price of $COIN to drop.
However, cryptocurrency has been believed by a few people as the currency of the future.
ETSY made its stock market debut on April 16, 2015, with an initial public offering of $16 per share. Etsy was able to sell 13.3 million shares at the time. Since the launch, ETSY has appreciated in value by about 15X. Put into real perspective, If $1million was invested in $ESTY in 2015, the current value should be over $14million.
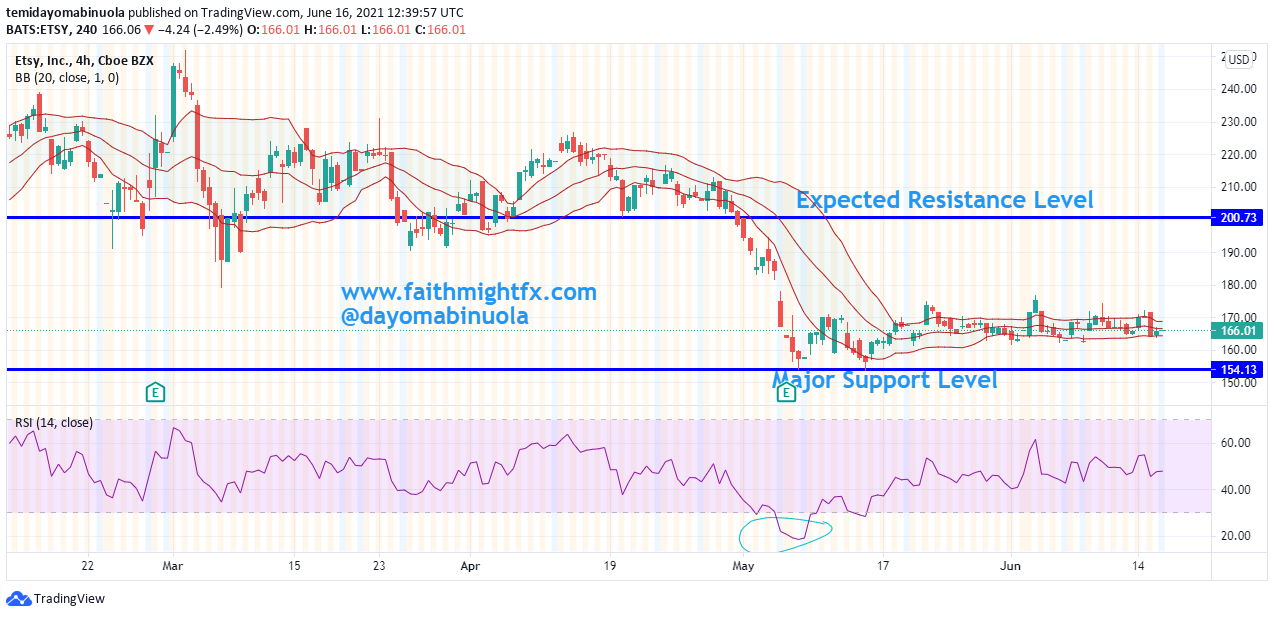
ESTY has maintained a bullish run in the past 6years, reaching an all-time high at $252.53. However, Since the all-time was attained, the price has started to dip. A head and shoulder pattern has been formed between February and April of this year, which brought about a range between $190 and $252.
After the head and shoulder pattern has been formed, there came a dip which made the price reach $153. Since the price fell from an all-time high at $252, $ETSY has lost 39% of its share price. Since the beginning of May 2021, $ETSY price has been between $153.80 and $176.50. Indications show there would be a breakout soon. To the downside or to the upside? There are chances price might appreciate towards $200 in the coming weeks. Business Insider has opined that the next coming month might be bullish for $ETSY( ). Since the recent dip in price, RSI has signaled that the price has been oversold.
Since Bitcoin was launched in 2009, price has maintained a strong bullish movement with about 410,000% gain, from $0.09 in 2009 to its current price at $36,700. The current $BTC market capitalization stands at $678Billion. Ethereum, on the other hand, is the second largest crypto with current market capitalization at $299Billion after its launch in 2015.
This signifies that most crypto assets are less than a decade. Ethereum has since its inception has been publicly accepted by Crypto traders and investors. Hence, the reason for the bullish movement. Just like other markets, the crypto market is a bull and bear market. High leverage usage must have wiped off some accounts due to greed. Currently, the crypto market is about $1.62Trillion with Bitcoin and Ethereum having over 61% of the market share. There are other thousands of cryptos newly introduced e.g. Ripple, Dash, Tether, Litecoin, Cardano etc. all of these make up the remaining 39% share of the crypto market.
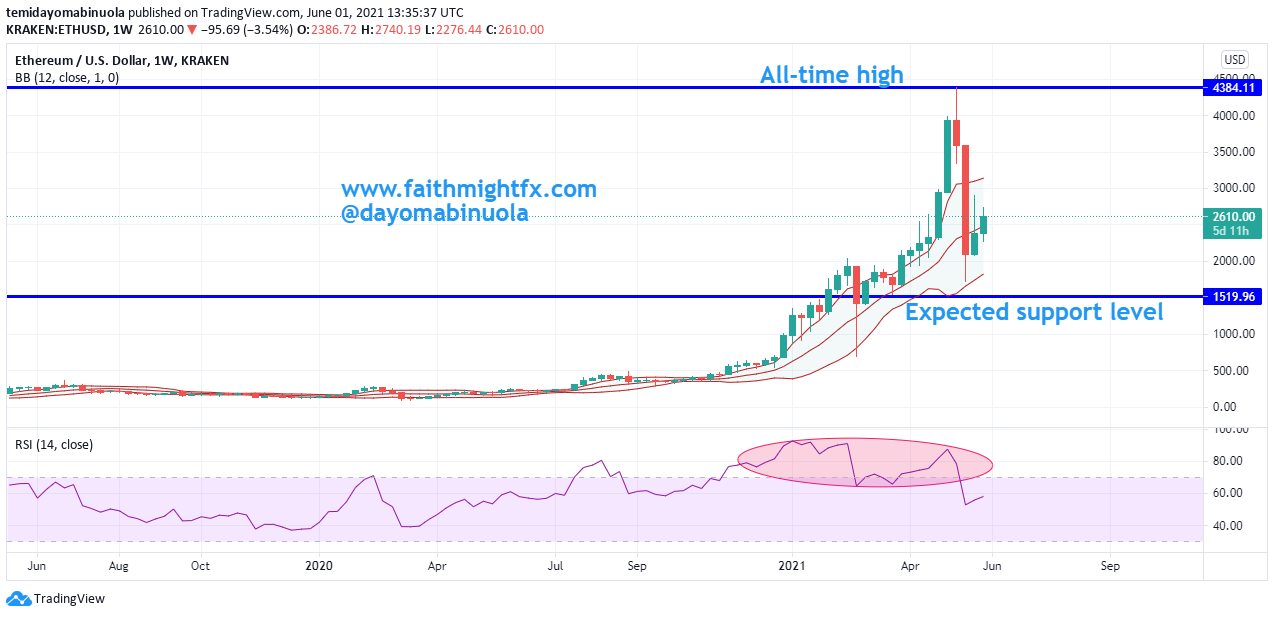
Bitcoin, in June 2020, was below $10,000. As at today, Bitcoin is above $36,000. Ethereum in June 2020 was below $300, the price of Ethereum today stands at $2,600. In the last one year, Ethereum has done far better than Bitcoin in investment gains. Both Bitcoin and Ethereum reached an all-time high in 2021. Ethereum reached $4,370 in may 2021 and Bitcoin reached $63,000 in March 2021. With Bitcoin and Ethereum having 61% of the total crypto market, they both have a major influence in the price movement of other coins. The increased acceptability of Bitcoin and Ethereum will determine the acceptability of other coins.
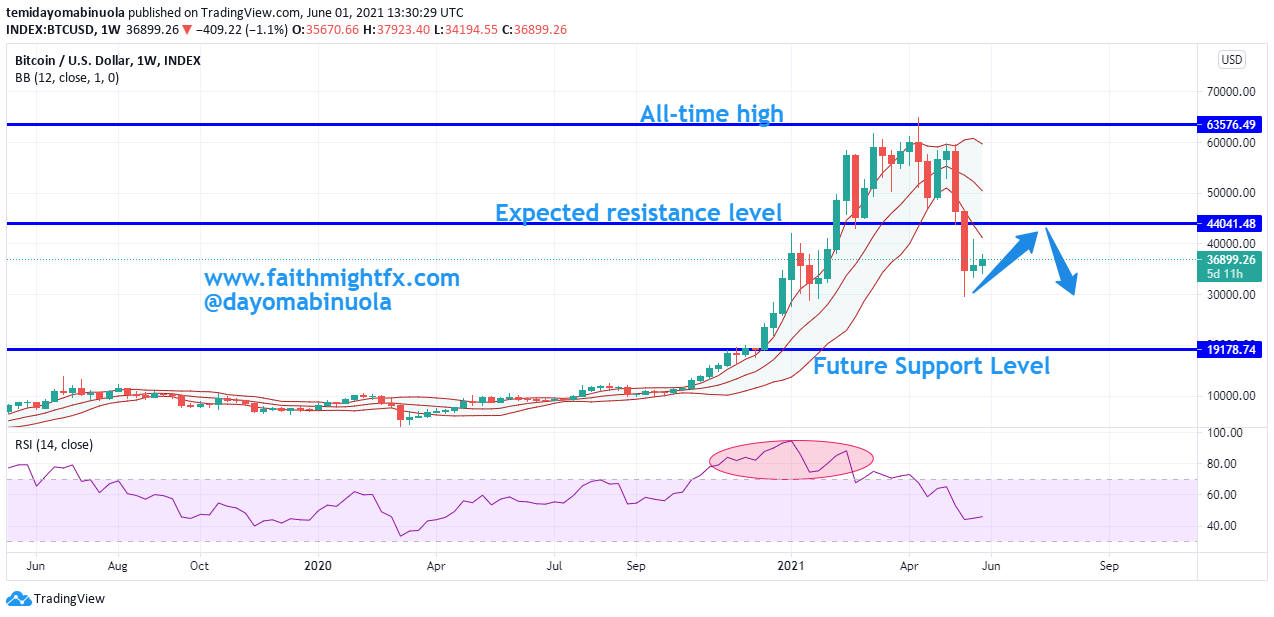
After the all time high was reached in March 2021 at $63,000, price was almost halved after it reached $31,200.
About $30,000 was wiped out in the price of Bitcoin last month, which made it the worst month in Bitcoin history with 41% lost from the highest price. Bitcoin has a very strong resistance at $43,980, a bullish breakout from this level might result in a fake out as price on the weekly chart is currently in the lower region of the Bollinger bands. The recent dip affected most of the assets in the Crypto market. Price of $BTC might rally towards $44,000, but the bears might push the price lower to reach $19,000. If a dip occurs, this will reflect in the prices of other cryptos. The next dip might also push price of Ethereum to $1,500.
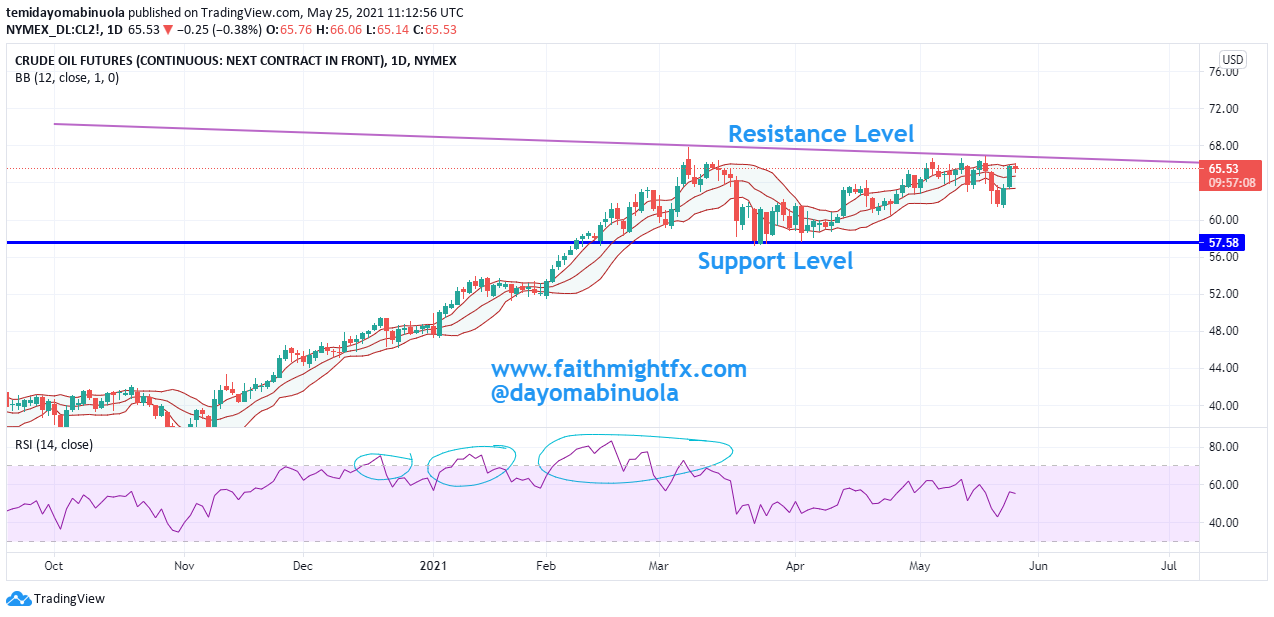
Since the ease of lockdown across different nations, oil price has been on a bull run. Price reached the highest level at $68.05 in March 2021. The last time price reached this level was in October 2018, before the pandemic.
The pandemic caused the price of CL_F to fall to negative prices. There were expectations that the price would rise before the pandemic and we wrote an article on the expected rally in oil price. The article published in 2019, says price could reach $69 per barrel. Using the daily and weekly chart, it was expected, but the pandemic brought about a reversal in price. However, in March 2021, the price reached $68.05.
The opening price of Oil in 2021 was at $47.20. Oil price was able to appreciate by over 44% this year. Since the price reached the highest level of $68.05 in 3years, price has been in a range. This could mean that $CL_F is consolidating. There are key pointers indicating that this is as a result of increase in Covid-19 variants which poses fresh threats.
Further pointers show the current oil price being greatly affected by a new disease named –Black Fungus linked with Covid-19 patients. Since March 2021, the ranging price of Oil has been between $57.28 and $68.05. Though price has been retesting more of the resistance level at $68.05.
RSI at three instances show that price has been overbought since December 2020. A reversal in price might occur, which might bring the price to $57.70 in a few weeks or months. Despite price movement in the lower region of the Bollinger bands at two times in the last 3 months, price is back to the higher region in the daily time frame.
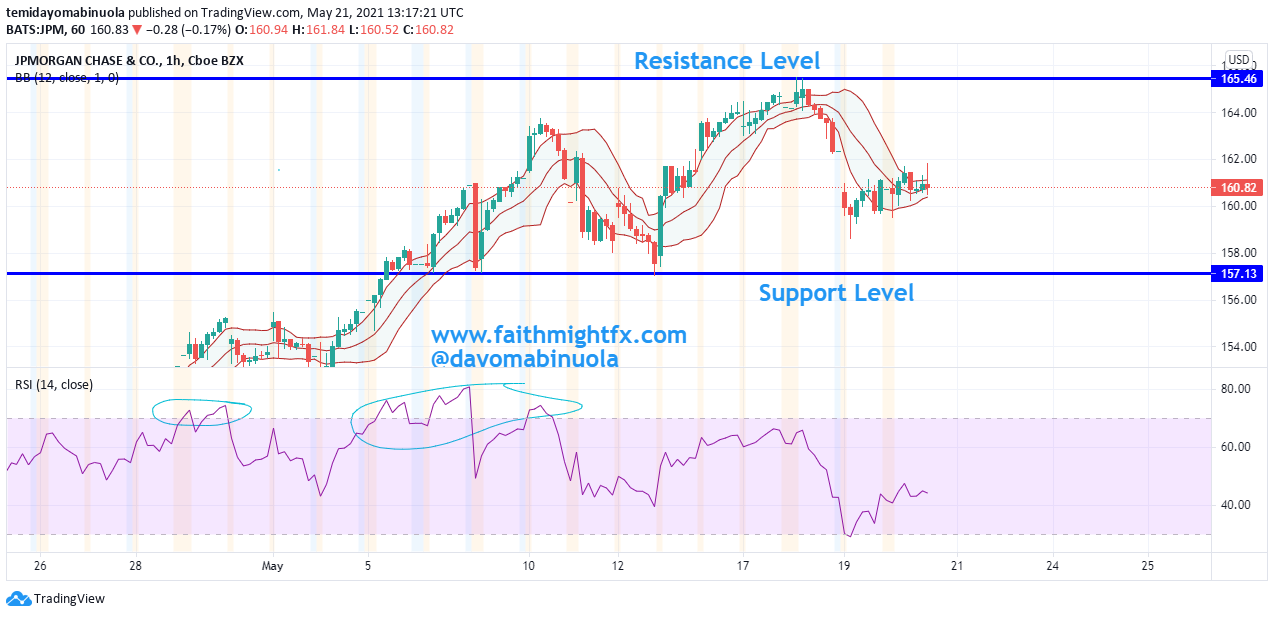
The lowest price of JPM in the last one decade was at $27.71. In contrast, the current all-time high of JP Morgan chase was reached on the 18th of May 2021 at $165.43. JPM has done about 6X in the last one decade and still looks promising.
Recall, there was a sharp drop in price from $140.48 to $76.52 in 2020. After the correction, a strong support was formed around the price level at $76.52 in March 2020. Since then, monthly candlestick has continued to indicate the full strength of the bulls. In This year alone, $JPM has done over 26.3%.
A gap down occurred in the price of $JPM on the same day of the all-time high. The gap down might be closed with a bullish movement. RSI in the last two months has shown that price has been overbought.
Could this be an indication for a reversal in the price of $JPM? There has been a bullish squeeze since the gap down and a new resistance formed at $164.65. A continuous bullish movement might push price above the resistance level. A breakout of the resistance level might push price to a new all-time high above $165.43.
This is the big question begging for answers in the heart of many traders and investors.
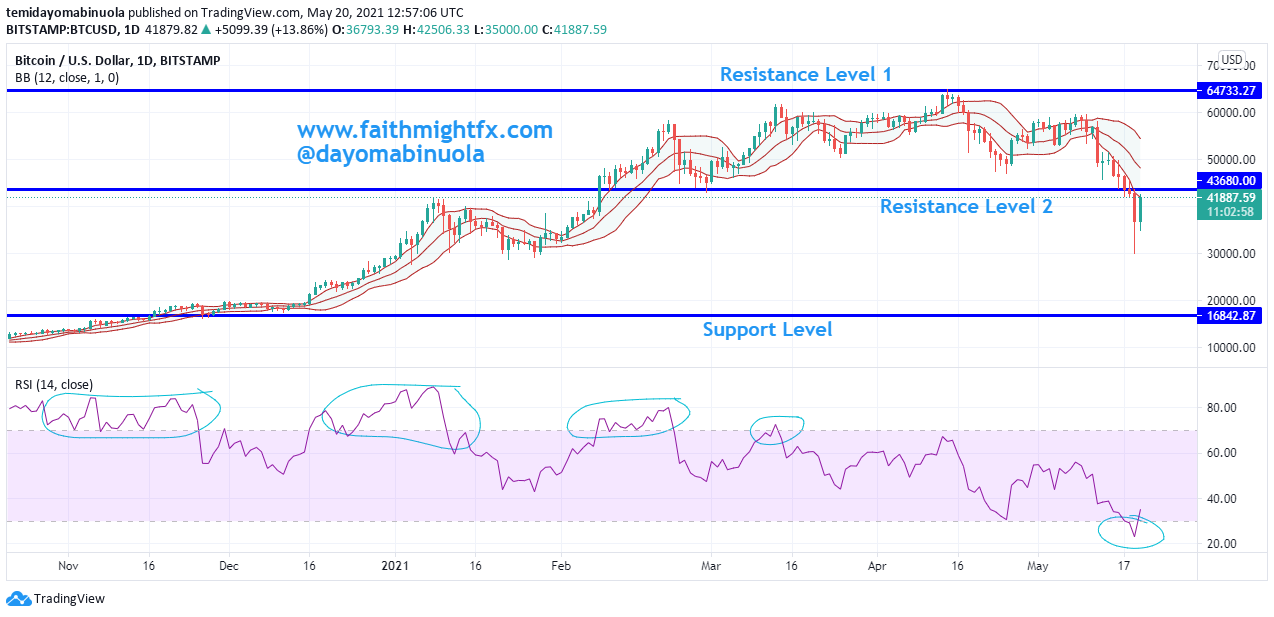
In the past, there had been many speculations predicting the price of Bitcoin to reach $100,000. Attempting to hit that $100,000, BTC reached the all-time high at $61,000 in March 2021. Since then, price has been retesting around $61,000.
Using the daily Chart, BTC in the past shows that price has been overbought. There are over 4 instances of price being overbought on the RSI with the bulls pushing price from $3,940 in March 2020 to $61,000 in March 2021. BTC has been able to do 15X since March 2020. The weekly time frame revealed the bull dominance since the beginning of the year 2020.
As it stands, the weekly charts show strong bearish dominance which might last for about a year or more. As price could not break the resistance level of $61,000 to the upside, throughout the month of May 2021, price has been ranging between resistance Level 1 and resistance level 2.
Yesterday, price was able to break the support level at $43,680. Many blamed Elon Musk for dumping the use of Bitcoin to purchase Tesla earlier in the week, which might have made $BTC to dip. The current price of $BTC is below $40,000, with the price of $BTC finding a new resistance around $43,680. A continuous dip might push price to $19,000.There is currently no bullish opportunity on the chart. A breakout of price to the upside, above resistance level 2 might push price upwards. However, the breakout might be a fake one.
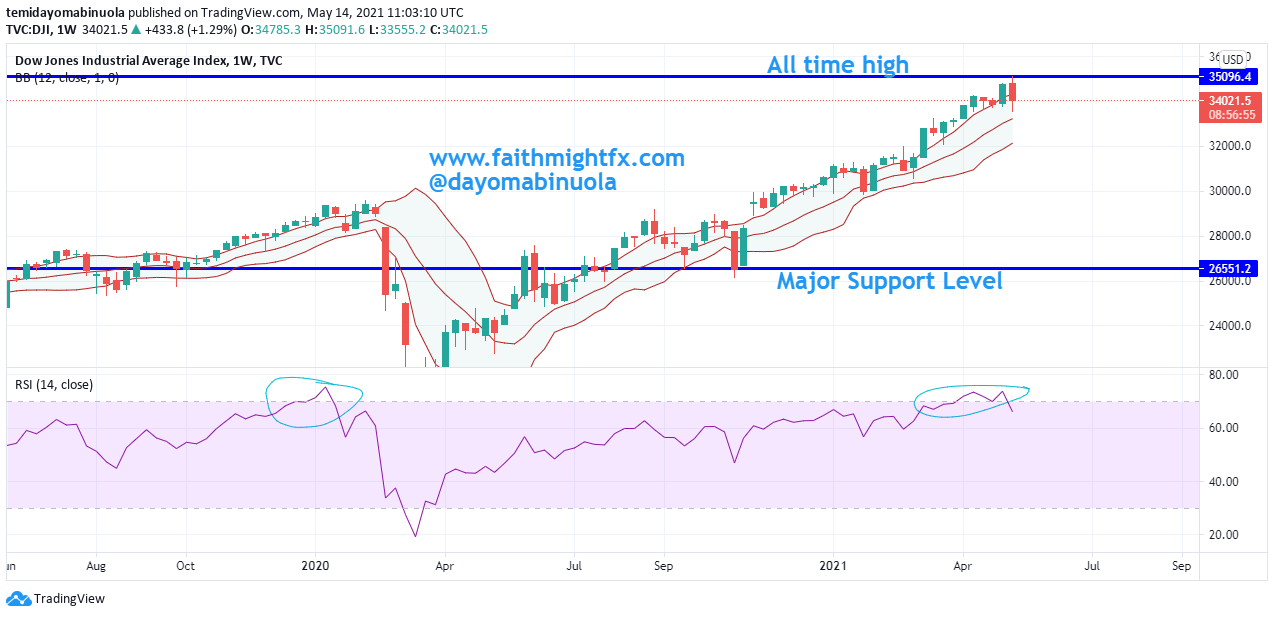
After a major dip to $18,900 occurred in the price of Dow Jones in March 2020. Price retraced to the resistance level at $29,500 in the same month. $DJI broke the resistance level at $29,500 in November 2020. Since this breakout occurred, $DJI has consistently reached a new all-time high every month. The recent all time high occurred this week at $35,100. $DJI’s price at the beginning of this year was at $30,200. As at today, price of $DJI is at $34,000, which is about 11% gain in 2021.
After the all-time high at $35,100 was reached this week, two bearish candlesticks were formed in the next days. These two candlesticks were as a result of the inflation data that was released on Wednesday. the $DJI plunged 680 points. Investors might have been fearful, hence the reason for the selling. Both S&P 500 and NASDAQ also took a nosedive. Could this be sign of the beginning of a bearish trend?
When a major dip occurred in March 2020, RSI showed price has been overbought. RSI is currently showing that p rice has been overbought. This could lead to a major dip in price. If this dip occurs, it might make price reach the support level at $26,550. If In the next few weeks, price might just be consolidating around $34,000. If the inflation situation worsens, price might plunge further.
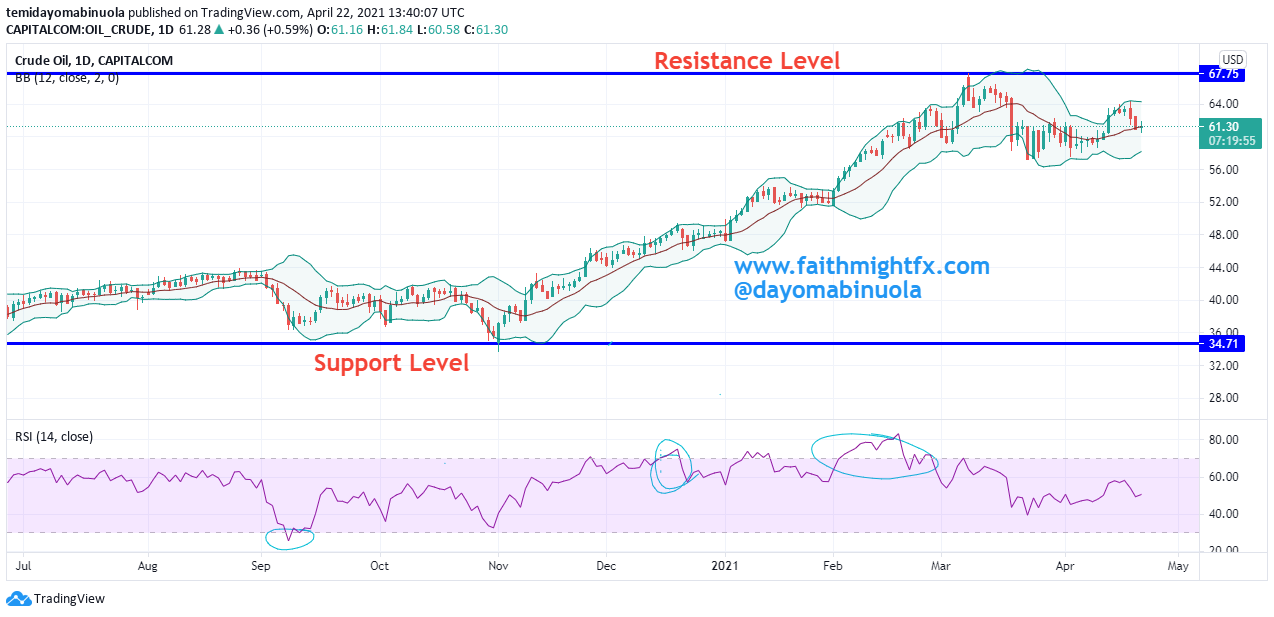
The global lockdown made price of Crude Oil fall to the negative region. The price of Crude Oil began to increase when a gradual ease of the lockdown began last year. The highest level crude oil price reached in 2021 was at 67.83. Before 2021, this level was reached in October 2018, which was a year before the coronavirus was declared a pandemic. Prior to the pandemic, the price of crude oil ranged between $42.73 and $66.76, until a dip occurred as a result of the lockdown. The current price of crude is at 61.00 as price has been ranging from 57.28 and 67.83 in the last few weeks. Few countries like Italy is back to lockdown due to spike in Covid-19 cases. Also, some cities in India are not left out. Hopes are currently being dashed due to increase in Covid-19 cases, despite vaccines are being administered across the world.
There are 4 instances of RSI showing price being overbought in the last two years. This year has been bullish with the $CL price, which opened at 47.15 to reach the highest level at $67.83. Towards the end of last month, price has been able to move to the lower region of the the Bollinger bands, which might be an indication of a reversal. If Covid-19 cases continue to rise across the world, the price of $CL might be lowered towards the support level at $35.85.