fbpx

Strong Yen Implications

The $GBPJPY continues to slide. The Japanese yen rally has become sustainable as the Bank of Japan (BoJ) continues to give indications that it is considering a shift away from its quantitative and qualitative easing (QQE) program. This is a very subtle shift in BoJ sentiment that is not getting much media attention. Less QQE means that the BoJ erodes at the divergence gap in monetary policy that it has had with other major central banks for several years. Manufacturing PMI released last week was higher than expected, helping to confirm the BoJ’s optimistic economic outlooks for Japan. This hawkish tone is helping to strengthen the Japanese yen now at a time when risk aversion flows may be re-entering capital markets. The geopolitical wars and diplomacy tensions around the globe are starting to wear on investor sentiment. As U.S. equities weaken, the Japanese yen continues to be the largest beneficiary of increases in risk aversion flows. The new trading week opens with the $GBPJPY trading at extremely oversold levels. Despite its bearish sentiment in the medium term, the $GBPJPY may consolidate the new lows below the major 170.00 psychological level.

GBPJPY WEEKLY CHART

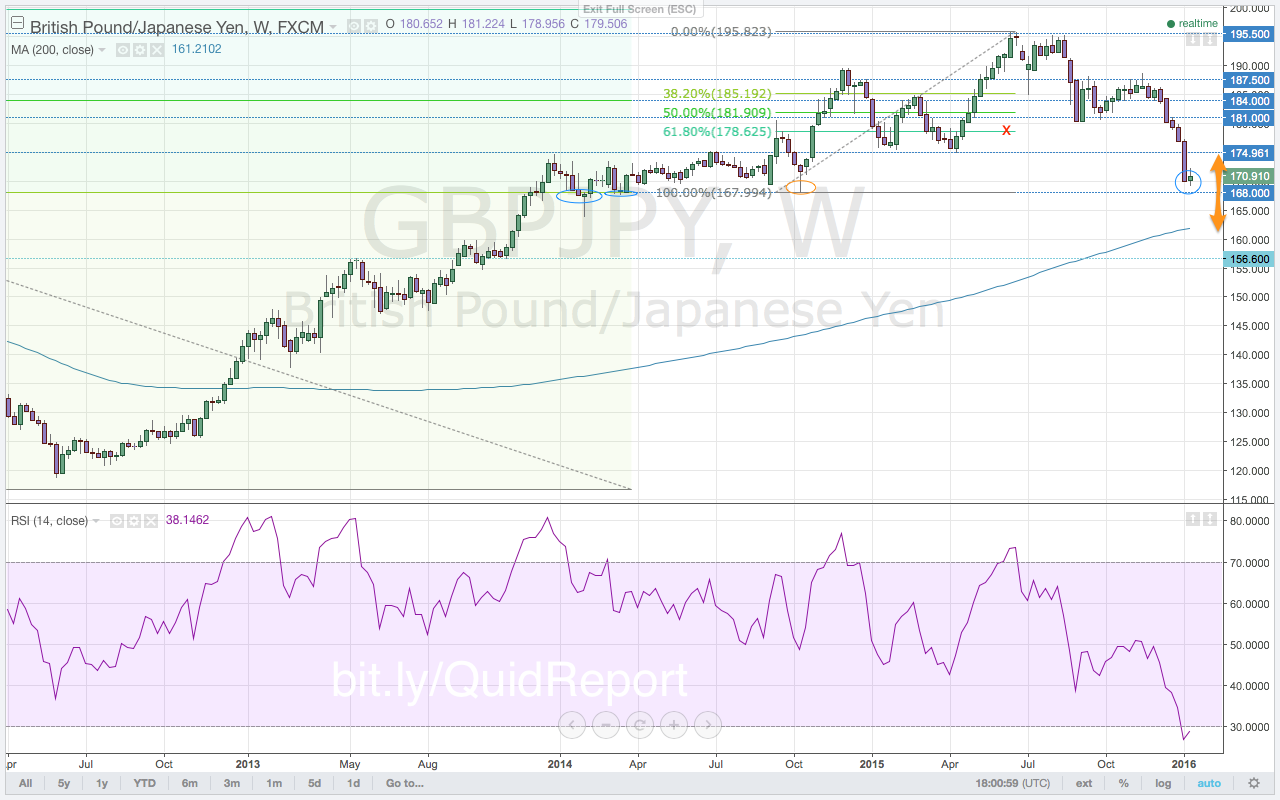
The $GBPJPY has not staged a correction since breaking below the 184.00 support level back in early December. The break below the 175.00 support level with the extremely shallow rallies is a major signal of bear strength as the $GBPJPY continues to grind lower. The $GBPJPY breaks nominally below the 170.00 psychological level as the new trading week begins, subtly indicating that the staunch support level is being met with more bearish psychology than last year. Perhaps with the RSI at extremely oversold levels, the $GBPJPY will bounce higher as sellers exhaust. A “healthy” correction off the new 169.30 lows moves the $GBPJPY back toward the 175.00 level to the sell zone starting at the 173.45, 38.2% Fibonacci level. Sellers are lined up to the 176.00 resistance level. Given the importance of the 170.00 support level on a bearish move that has seen very little retracement, a strong bounce is highly likely. More aggressive traders will look to take advantage of any move higher to establish a short position in the $GBPJPY. Continued strength in the Japanese yen is likely especially as crude oil prices remain so low, which is an aide to the Japanese economy.

Premium trade setups with targets and stops are published in the $GBPJPY Outlook for the Week in Volume 45, this week’s Quid Report.

Harmony in the Fed

The new year opens with a very significant start for the pound against the U.S. dollar. The only other time in recent history that the $GBPUSD opened the new year at lows was back in January 2002. At that time, the $GBPUSD bottomed as buying momentum picked up with the RSI finding support at the 40.0 level on the monthly chart. This time, however, is actually a bit different. Momentum is sliding to lows on the RSI. The $GBPUSD has gapped lower as the first trading week of 2016 gets underway. This gap down has cleared the zone of support between the 1.4750 level and the 1.4800 level. This zone has been an area of supply for the $GBPUSD eight times in the past sixteen years. It supported price last week as sellers took profits and established new positions against the support zone. Now this gap and subsequent move lower is a strong indication of further selling in the $GBPUSD. Strong economic reports from the UK may give sellers a reprieve. But the calendar is dominated by economic news out of the United States this week. Risk aversion is already entering markets as U.S. equities open 2016 with pronounced weakness. Any strong news about the U.S. economy is likely to rally the U.S. dollar further. Having broken below the 1.4680 level, the $GBPUSD is poised to test lows at 1.4565.

GBPUSD DAILY CHART

Premium trade setups with targets and stops are published in the $GBPUSD Outlook for the Week in Volume 44, this week’s Quid Report.

QUID REPORT LIVE

Due to the holiday shortened week and it being the very last week of 2015, no Quid Report was published this week. Instead, I am doing a video update to last week’s written report. While I have been on many forex shows, this is my first time hosting a live broadcast. This should be a quick update and review for the week in progress. Enjoy! And please leave your feedback in the comments. Perhaps this will be a new thing for me in 2016.

EUR WTF

The European Central Bank (ECB) lowered its deposit rate this month by 10 basis points to -0.3%, moving rates further into negative territory. Additionally, the ECB extended its current quantitative easing (QE) program well into 2017 while maintaining the amount of bonds purchased each month. The ECB wants to support Europe for as long as possible. They need to. While these changes in policy constitutes huge monetary action by the ECB, the market was expecting an increase in QE not just an extension and slight adjustments of the same program. The market also anticipated a larger interest rate cut than 10 basis points. This was less aggressive easing than the market was actually expecting. For this reason, the euro continues to rally tremendously (Volume 41). Despite the strong rally that gripped the $EURGBP in the aftermath of the ECB monetary policy easing, there had been no real follow through in either direction for the past two weeks. Dips were met with buyers while sellers capped rallies. Consolidation below the 0.7250 resistance level was not necessarily bearish price action. Despite breaking above the 0.7250 resistance level, the $EURGBP was unable to close above it until the Friday close last week. Additionally, the Friday close remains above the key 0.7100 level (Volume 22) and is a higher close than the previous close on the weekly chart. As such, the $EURGBP maintains its bullish bias for the new trading week.

EURGBP DAILY CHART

The $EURGBP has to move below the 0.7200 support and psychological level in order to change the bullish momentum. Last week, sellers continued to step in at and above the 0.7250 level. However, the lows were also met with its own supply. Buyers have been stepping in at the lows above the 0.7200 level. After the volatile surge higher, two weeks of consolidation does not signal a reversal. In fact, consolidating at the highs actually signals a move higher, depending on how the new week opens (Volume 42). As the new trading week opens, this nascent bullish signal has manifested as the $EURGBP has finally moved higher to break above the 0.7300 resistance level that had capped rallies for the past two weeks. This explosive move higher will likely be met with profit-taking after the long consolidation. Pullbacks off the highs need to find support above the 0.7300, now turned, support level. Given price action during consolidation, it is highly likely that it will.

Premium trade setups with targets and stops are published in the $EURGBP Outlook for the Week in Volume 43, this week’s Quid Report.

Will They Deliver?

All eyes on the Federal Reserve this afternoon. Will they raise interest rates? Will they sound hawkish? Will the USD rally? Watch this big picture view headed into, and immediately after, the Federal Reserve announcement for future direction in price action for the $GBPUSD.

GBPUSD WEEKLY CHART


Premium trade setups with targets and stops are published in the $GBPUSD Outlook for the Week (Volume 42, this week’s Quid Report).

Australian Dollar Defies Commodities

The Australian dollar found strength when the Reserve Bank of Australia (RBA) monetary policy minutes confirmed that the central bank would not move on monetary policy again this year. Though the RBA believes that monetary policy needs to remain accommodative, markets have reacted positively to the decision to leave monetary policy as is. The $GBPAUD has since moved in a down channel on the back of Australian dollar strength. Last week, the weakness in commodities finally caught up with the Australian dollar. The Australian dollar finally weakened in the face of extended new, multi-year lows in commodities. After moving to the bottom of the channel, the $GBPAUD respected support at the lower trendline of the channel. Price rallied higher on the back of the weak Australian dollar. A rally in the $GBPAUD was expected to rally back to the trendline at the top of the down channel. Given the velocity of the moves in commodities, the $GBPAUD managed to return to the top of the channel in just one week of trading. While the $GBPAUD was met with profit-taking just ahead of the key 2.1200 resistance level, the new trading week opened with a move above resistance to 2.1216. However, sellers stepped in at the highs ultimately respecting the upper trendline resistance and moving price back to the key 2.0800 support level.

GBPAUD DAILY CHART

The top of the channel here has confluence with the key 2.1200 resistance level. For the $GBPAUD to continue to rally, the $GBPAUD needs a confirmed close above the 2.1200 level. Ahead of the channel bottom is first the major 2.0800, now turned, support level. There is also confluence with that support level at the 50% Fibonacci level of last week’s rally. The 2.0800 level remains the key level for direction. With no confirmation on the break above the 2.1200 level, the $GBPAUD actually opens the new trading week bearish even with a Friday close at the highs. The $GBPAUD continues to trade in this channel. As such, after reaching the top of the channel, the $GBPAUD is biased bearish based on the technical developments in price action. Price has already moved to 2.0818 finding support just above the 2.0800 support level. With commodities crashing again as they did this time last year, the Australian dollar should experience another tremendous selloff. However, $GBPAUD price action suggests further Australian dollar strength in the face of weak commodities.

Premium trade setups with targets and stops are published in the $GBPAUD Outlook for the Week (Volume 42, this week’s Quid Report).

King Dollar Won’t or Must Weaken

GBPUSD WEEKLY CHART

The USD found renewed strength last week as the ECB and PBoC ease monetary policy further. The new failed high on the breakout rally from 1.5109 to 1.5507 signaled a move back to the 1.5162 support level. A move to the downside is first met by the 1.5250, now turned, support level. A move lower in the $GBPUSD will be largely dictated by the moves in the S&P 500. If equities continue to advance, it is more likely that the USD weakens yet again sending the $GBPUSD to rally. Today’s release of the core PCE price index has markets back to expecting the first Federal Reserve interest rate hike to take place after June 2016. Risk appetite returning to markets on the back of S&P 500 strength has also added to USD woes. TWith risk appetite returning to markets on the back of S&P 500 strength, however, the USD strength has not been sustainable.
Outlook for the week:…


This is an excerpt from this week’s issue of QUID REPORT. Subscribers receive my research on all major GBP pairs at the beginning of the week, including access to @faithmightfx on Twitter for daily, real-time updates to the weekly report. AVAILABLE NOW.

Kiwi May Fly, But Stuck For Now

GBPNZD DAILY CHART

In light of the substantial dip lower in dairy prices last week, this week’s interest rate announcement from the Reserve Bank of New Zealand (RBNZ) should be given attention. If the RBNZ expresses caution about dairy and commodity prices, the New Zealand dollar will weaken. Dairy prices led other commodities with a bottom over five weeks ago. This consequently exhausted buying momentum in the $GBPNZD due to NZD strength. The decreasing momentum allowed the $GBPNZD to break lower in the past four weeks of trading. The new lows find support ahead of the large 50% Fibonacci level at 2.2307. The correction higher into the sell zone also finds resistance against the 2.3000 psychological level. The confluence here makes a break above the 2.3000 level a significant technical development. However, this may not be likely if the RBNZ remains neutral in sentiment and monetary policy. Rather, the $GBPNZD is carving out a range for itself between the 2.3000 level to the upside and the 2.2400 level to the downside. A break to the downside could potentially be a false break with the 50% Fibonacci level just below the support level at 2.2307. Therefore, the $GBPNZD may continue range bound for the week depending on how the market reacts to the RBNZ and Federal Reserve interest rate announcements.

OUTLOOK FOR THE WEEK….


This is an excerpt from this week’s issue of QUID REPORT. Subscribers receive my research on all major GBP pairs at the beginning of the week, including access to @faithmightfx on Twitter for daily, real-time updates to the weekly report. AVAILABLE NOW.

Dollar Dump

Federal Reserve Chairwoman Janet Yellen continues to insist that the central bank will raise interest rates this year. As such, the USD is showing strength on Yellen’s jawboning. The Federal Reserve has 3 months and only 2 more meetings scheduled ahead of the year end. Up until the release of the U.S. non-farm payrolls report, U.S. equities were not responding to the hawkish calls. Further weakness plagued the $SPX after it declined to the August 24th Black Monday lows. It was unable to sustain any rallies until Friday’s release of the weak U.S. jobs report. As long as industrial sectors are tepid, inflation is low, and the labor markets are softening, the Federal Reserve members don’t seem to agree that raising rates after ending QE is the correct course of action. Despite the Federal Reserve delaying to increase interest rates, the rally that occurred on the back of USD weakness (Volume 30) was completely reversed. Now that the market finally believes that the Federal Reserve will take no action on monetary policy, the $GBPUSD will likely rally on risk appetite and USD weakness. The failed high on the upside break of the consolidation range resulted in a new low lower than the previous low at 1.5135. With the move off the failed high complete, the $GBPUSD is free to move in either direction. With risk appetite returning to markets on the back of $SPX strength, the USD may weaken in this new week of trading. The lows circled in orange is a formidable zone of support to the downside. All attempts to move below 1.5162 has been met with supply. The new trading week opens finding resistance at the 1.5250 level. A break above this level fuels a rally back towards the 1.5500 level.

GBPUSD 4 HOUR CHART

After holding below the Friday highs, the $GBPUSD has moved lower as the new trading week gets underway. Price is back below the 1.5200 level signaling a return to the support zone starting at 1.5162 through 1.5100. A break lower moves to the 61.8% Fibonacci level where there is confluence with former lows at 1.5089 and the key 1.5076 level. However, weak fundamentals from the U.S. could also rule price action this week. The week kicks off with the release of the non-manufacturing ISM number during the Monday open. Soft U.S. economic reports will counter intuitively rally the S&P 500 as the market interrupts weak data with dovish U.S. monetary policy. This interpretation weakens the USD because it will signal an increasingly dovish Federal Reserve. If equities respond to weak economic data with more weakness, however, risk aversion will strengthen the USD.

Outlook for the week:


This is an excerpt from this week’s issue of QUID REPORT. Subscribers receive my research on all major GBP pairs at the beginning of the week, including access to @faithmightfx on Twitter for daily, real-time updates to the weekly report. AVAILABLE NOW.