fbpx

Hope For Apple Bulls

$AAPL lost all its gains in 2018 starting in November. This might be due to the on-going trade wars. Since this fall in price, $AAPL shares reached 145.82. Before the huge fall in $AAPL share price, it had been overbought a few times. Using the weekly chart, price of $AAPL has been in the upper region of the Bollinger bands since August 2016 before it changed to the lower section of the bands in November 2018. $AAPL reached an all time high of 228.39 in September 2018.


The fall in $AAPL share price made the RSI show an oversold position. The trendlines are already broken showing a bullish reversal. Though price sits comfortably in the lower region of the Bollinger bands, it is yet to fully reverse. From now, the activities of buyers might make the $AAPL shares to rise to 188.07 from its current 155.17. Ichimoku’s future still shows price is on the downtrend. However, the support level 145.82 is yet to be broken downward despite price retesting the level in the past four weeks. This could be an indication that $AAPL bulls are about to launch their efforts.

EURO APPRECIATES AGAINST THE FRANC


In 2018, the $EURCHF from the weekly chart shows a downtrend. In the penultimate year, $EURCHF shows an uptrend after a range in 2016. $EURCHF moved from the highest level 1.9805 in April 2018 to the lowest level 1.11901 in September 2018. The Swiss Franc gained over 8000pips against the Euro in 2018. Since the second half of 2018, $EURCHF has neither broken the support level 1.11901 nor the resistance level at 1.15031. $EURCHF’s average movement since July 2018 has been 300pips.

EURCHF WEEKLY CHART


An upward breakout of the resistance level could begin if many more EUR buyers get into the market. Since the beginning of this year, the $EURCHF has begun a bullish trend which might reach the resistance level 1.15031. The trendlines A and B have been broken though $EURCHF is yet to move to the upper region of the Bollinger band. The $EURCHF despite the bearish movement last year, it is yet to be oversold. There is a double-buttom on the weekly chart at the support level which technically signifies a bullish movement may begin. A reversal might occur due to EUR buyers getting into the market.

Wells Fargo Could Be On The Rise

The share price of $WFC went down in 2018 for about 2100 points. It was not really a good year for investors of $WFC. A support level at 43.46 was last reached in October 2016. In the last month of 2018, it was all bearish for the $WFC shares though the bears have been in charge since September. An oversold position has been reached which might give room for investors to take charge. 2019 began with an obvious movement of the $WFC shares in favour of the bulls. Though, there are a few signs that the bulls have been active in the market in the last days of 2018.

Wells Fargo stock daily chart


The oversold levels were reached in December 2018 using the RSI. The quest for the $WFC shares to go bullish might have begun already because about 400points have been gained on the $WFC shares so far this year. Price is currently at 48.70. Stocks are beginning to gather momentum generally for bullish movements. There are very high tendencies that the price of $WFC will touch the resistance level 1 at 50.13 and eventually breaks the resistance.

Crypto Lovers, Bitcoin Is Currently Oversold

Despite low volatility in recent times, there may be few huge profitable chances. To take a look at Bitcoin, the year 2018 favoured sellers. In 2018, $BTCUSD started at 13228 level and closed at 3665.33. There were several speculations from few experts that Bitcoin will continue the uptrend as in 2017 but it went all the way down in 2018. The highest point Bitcoin reached in 2018 was 17165 which was in January and the lowest in December at 3172.28. Many investors have lost interest due to the uncertainties of $BTCUSD thereby reducing demand. Due to the lower volatility, investors might not necessarily trade $BTCUSD for the long term.

Bitcoin 4-hour chart

The first major bullish movement in the year might start soon if more buyers come into the market. RSI on the 4hr chart shows an oversold region for the past 5 trading days. Price is yet to cross to the upper part of the Bollinger bands but deliberate efforts of $BTCUSD buyers could push price to 4092 from its current 3564.

Tesla Maintaining A Bullish Trend

In 2018, Tesla stock opened at 316.64 and closed at 323.31. During the year, there were several highs and lows but resistance was maintained at 380.66 and support level was at 249.36. This technically signifies about 130points from the support to the resistance level. Last year, the highest point of $TSLA shares was in the second trading week of December at 380.66. The first day of trading in 2019 started with a dip in the share price of $TSLA. The price of $TSLA has been touching the resistance level several times in the past 8 months. Buyers are more active with the $TSLA stock. A breakout upward from the resistance level could lead to a major bullish movement on the stock. Market price of $TSLA opened at 305.53 this year. Since then, it tried to retrace upward to the closing price of 2018 at 332.36

TESLA 4HR CHART

RSI is yet to show an oversold reading despite a dip in momentum on the daily chart. RSI also shows momentum is currently above 50 on the RSI chart which indicates a bullish trend might begin soon. At the beginning of the week, momentum was bearish which might be an indication for the bulls to buy the downward movement. Ichimoku’s future shows a sign indicating a bullish trend might begin soon. The current price of $TSLA is at 334.40. Eventually with all these indications, if price of $TSLA continues to remain bullish, the resistance 380.66 might be reached.

ON THE AIR with F.A.C.E.

For our first sterling chat of the year, Dale and I got right into my thoughts on Brexit given the upcoming vote in Parliament next week. Other highlights include:

  • What to do with those flash crash wicks?
  • USD weakness persisting but not gaining
  • Yen strength
  • Commodity currencies vs. GBP

Enjoy!

Mentioned: My 2019 Outlook (FaithMightFX)

My 2019 Outlook

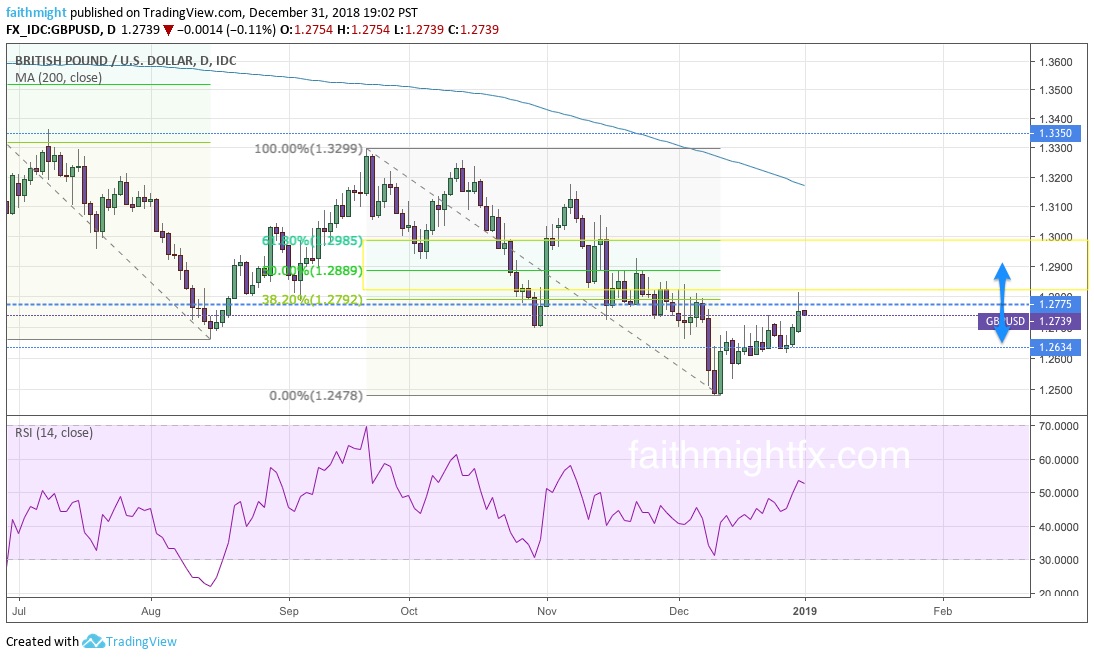
Despite today’s New Year’s Eve rally, sterling has closed 2018 at some of the lowest levels seen since 1985. That’s not insignificant. And given that we still have Brexit drama, the U.S. government shutdown, crashing equity markets and tightening monetary policy even if through unconventional means, 2019 is not shaping up to be a bullish year for sterling.

GBPUSD DAILY CHART

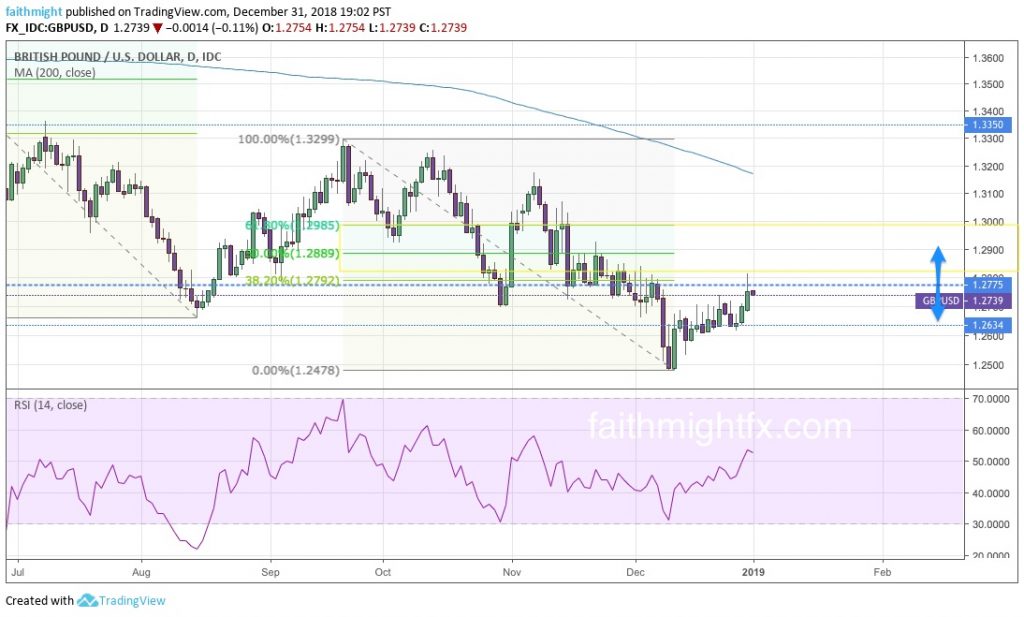
PREDICTION: The $GBPUSD will continue to rally to the 50% Fibonacci retracement level pictured above at 1.2889. Because the markets like to be cruel, I can see it moving even higher to the 61.8% Fibonacci level. At that level, so close to the major psychological level at 1.3000, bears start to turn bullish and major stops get tested. Just when it seems like sterling will really make a bullish reversal, it will plummet to make new lows at 1.2250. Later in the first quarter as the Brexit deadline approaches, the 2016 Brexit referendum lows at 1.1950 (depending on your broker) will be probed. The market’s reaction to the Brexit deal that does finally materialize will determine where we go from there.

The euro celebrates 20 years this year! And its 20th birthday may be a good year for the euro, particularly against this GBP weakness. But the $EURGBP remains fairly rangebound to start the  new year. In fact, it has been rangebound since late 2017 after reaching new highs at 0.9306. However, it is a bullish range as this sideways action for the past 2 years has never managed to move low enough into the Fibonacci retracement levels on the weekly chart.

EURGBP WEEKLY CHART

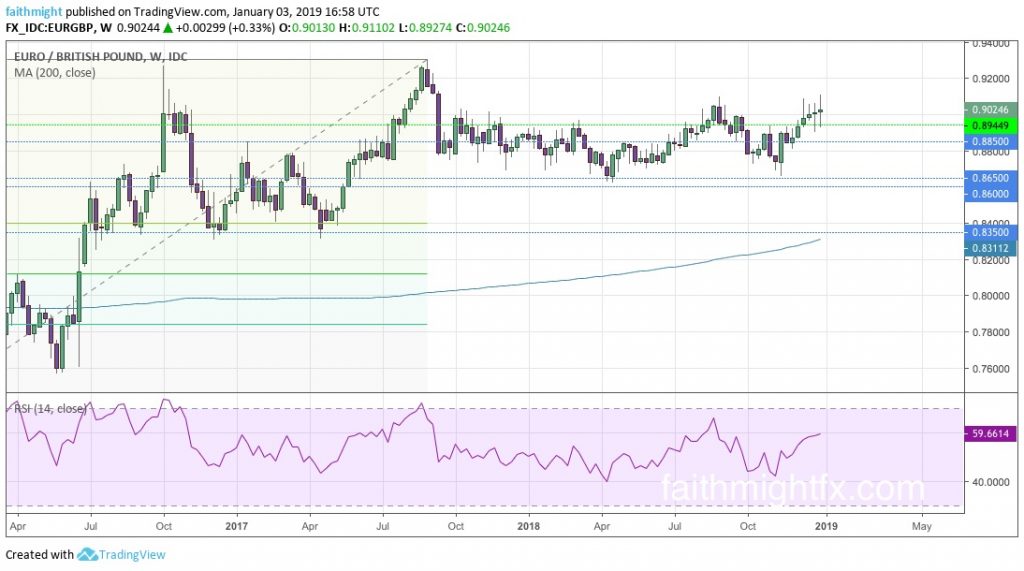
PREDICTION: The $EURGBP continues to move higher. But it will be a grind and stair step higher as the markets contend with European politics in France, Italy and Great Britain. When the market finally resolves this 2-year long consolidation period, the $EURGBP will reach and break above the 0.9306 highs set back in 2017.

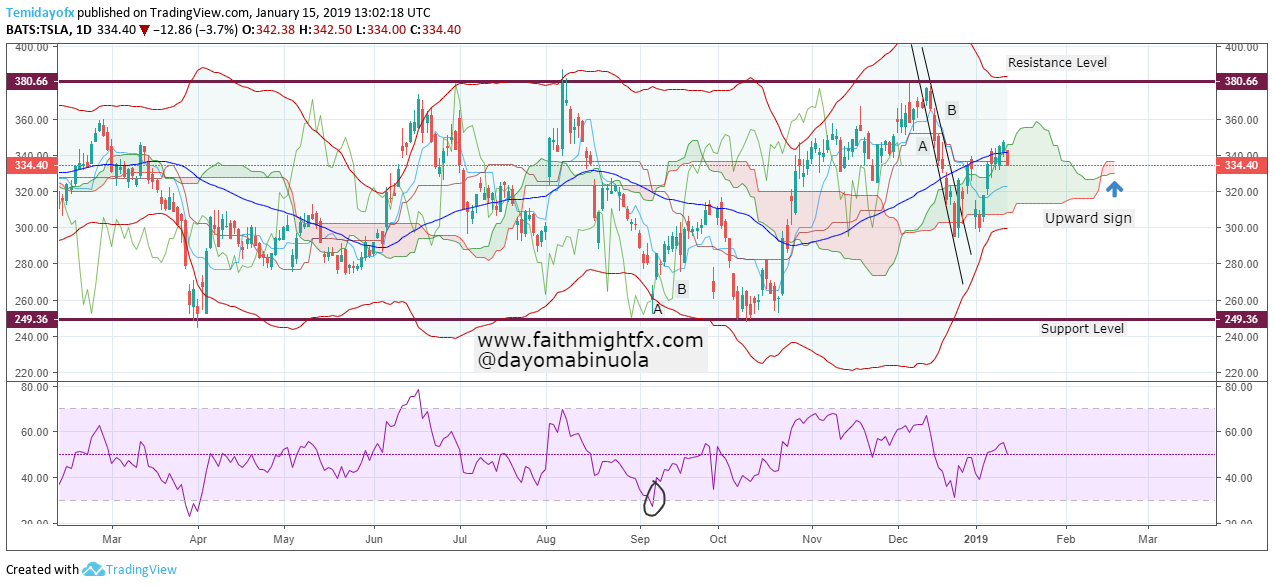
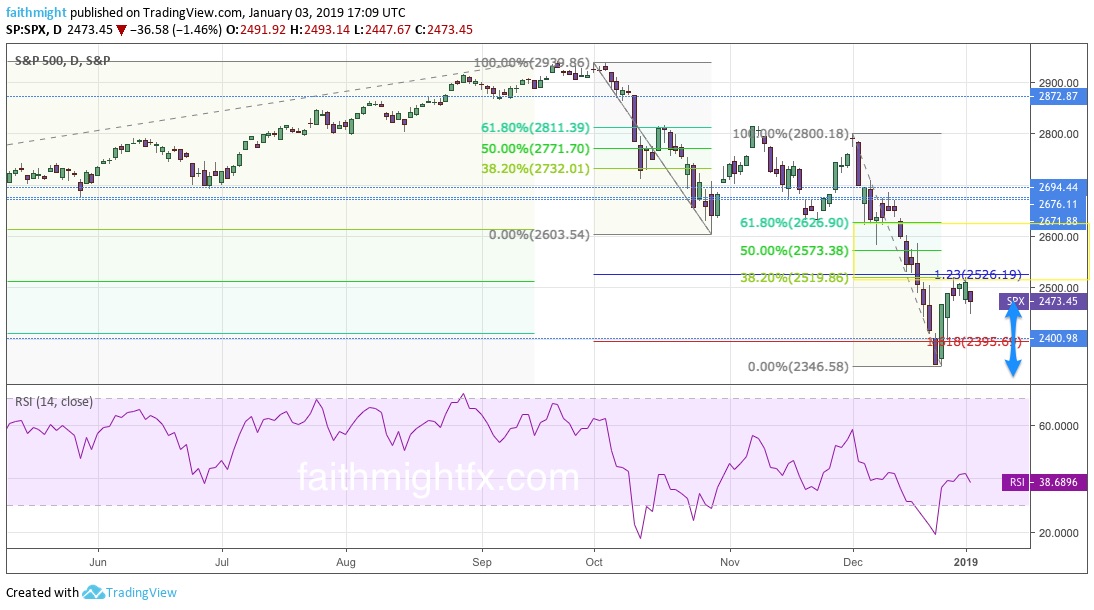
Equities rocked investors in 2018 when it did not deliver the Santa Claus rally that investors have come to rely on for the past 8 years. Instead, we were greeted with the worst Christmas stock market when the S&P closed down 2.71% on Christmas Eve falling to 2346. It was the worst Christmas Eve ever since 1985 when it fell 0.69%.

The 2400 level is a huge level in the S&P 500 ($SPX). This level marks the 2017 highs where price stalled, consolidated for a few months, and then barreled through that resistance to then new all-time highs. Those December lows mark a level of real support that I honestly have had my eye on since 2017. At that time, I expected a correction in price lower. Rather, it was a correction through time as bulls continued to buy the dips. This year, 2019, however, is a very different market.

S&P 500 DAILY CHART

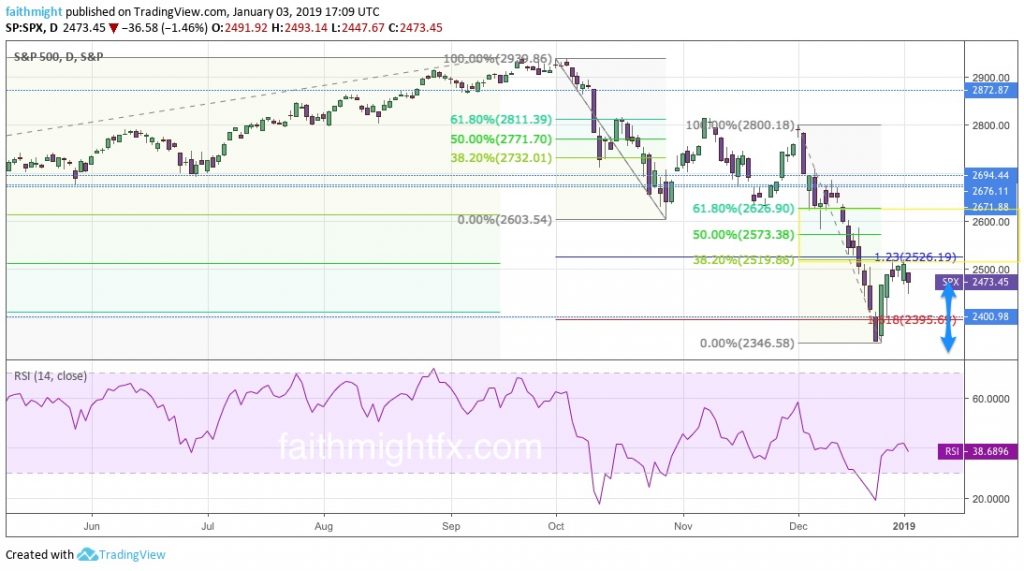
PREDICTION: It seems any corrective bounce higher will remain below the lows at 2600. Above the 2600 level, equities may be ready to start a new bull market. But if it can’t hold above that level, I would look for $SPX to make new lows below the 2400 level. A break below the 2346 low sees price move to the 2132 support level.

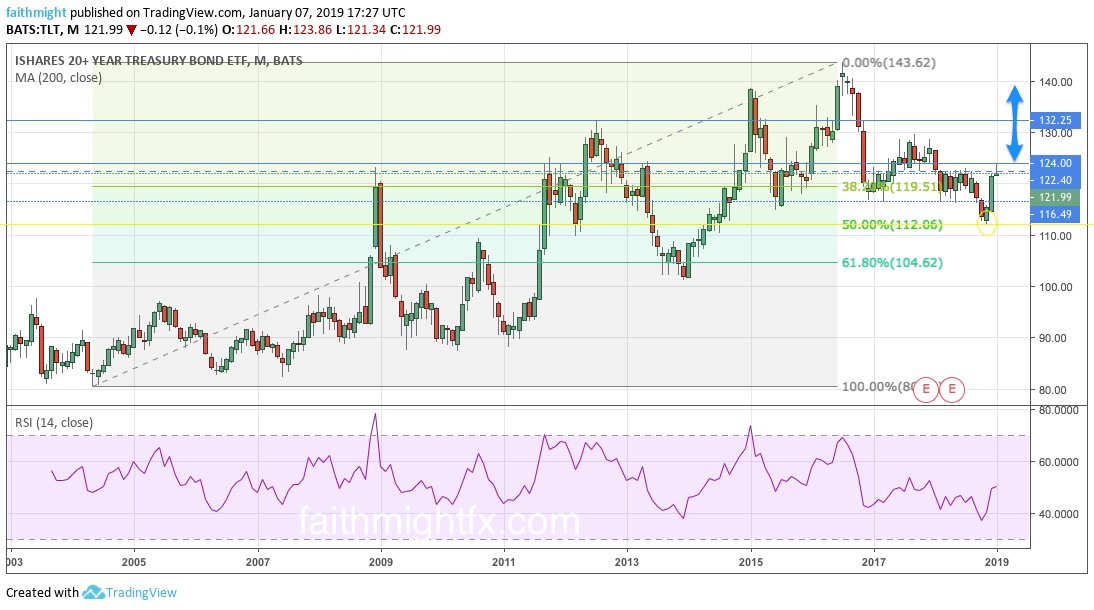
A discussion on stocks is just not complete without a mention of bonds. After peaking in 2016, $TLT plummeted just 2 months later. The $TLT was in a free fall right to the 116 support level where it consolidated before moving lower. Many cried that bonds were in a bear market and they would be right, looking on short to midterm timeframes. But on the monthly chart, $TLT was still in a correction (albeit a very deep correction). As such, the 2018 lows were very important. They marked the 50% Fibonacci retracement level on the monthly chart. It would have sparked mad capitulation had that level been breached.

TLT MONTHLY CHART

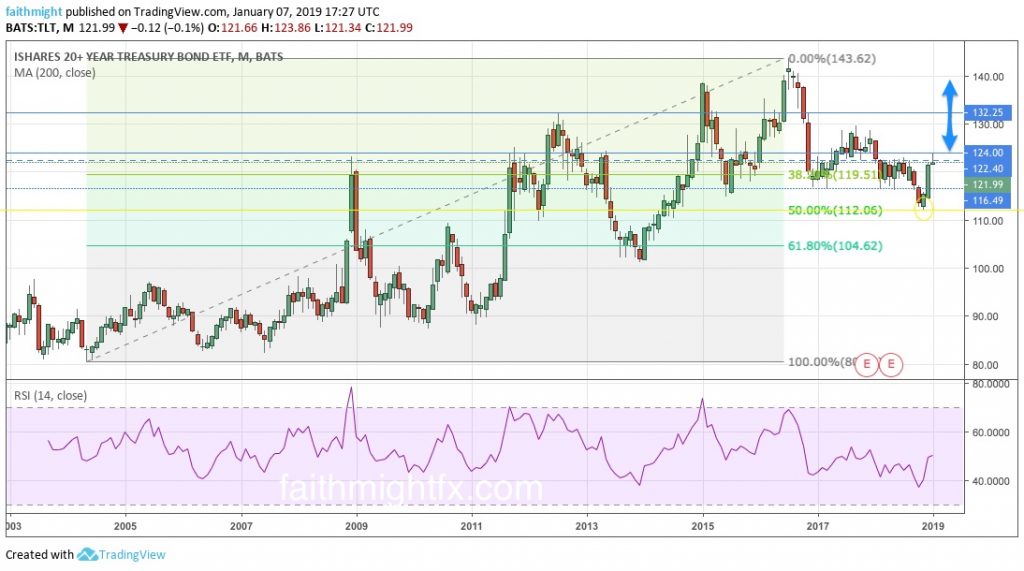
PREDICTION: Now that price has moved back above the 116 support-turned-resistance level, $TLT looks well-supported to move much higher from current levels. I like a return to 130 in $TLT. A move above that psychological level clears the way to 132.25 where the market will have to make a decision. Depending on how investors are feeling about risk, price would need to hold above 132.25 for the bull move to continue higher and challenge the all-time highs at 140.13.

2018 was a year full of ups and downs. Nicely, most of those ups happened in my career. The downs last year really did make me stronger and propelled me in new directions that should be very good for the company and my career in 2019. Cheers to the new year! ?

Source: @cubewealth

2018: Our Year in Review

The top 9 moments of 2018 in FM Capital Group! We entered our 4th year of business this year, setting milestones all along the way.

The TOP 9 OF 2018 FOR FM CAPITAL GROUP

  1. Our first company event. It was small because I forgot to advertise it ????? lol but it was very well received.
  2. My first TV appearance! I was so nervous ?
  3. Fast forward to my last interview of the year and I did my absolute best work yet. I came a looooong way ?
  4. That first company event led to our infamous #1stfridayspasadena events. This last one was our largest turnout yet! ??
  5. New profile pic!! ?????
  6. I’m so pleased to announce that this year I sowed the seeds to raise a new venture capital fund that will make investments in Africa and Latin America. Stay tuned in 2019….
  7. Our first hire!
  8. Dayo’s first article for us and the first new author on the blog since I launched it 6 years ago.
  9. I have been blogging on the financial markets, and mostly the forex markets, for almost 10 years I am so pleased to announce that this body of work has culminated in a book deal! I was approached by my publisher earlier in December and I’m starting the work and journey to becoming an author. WOW! Stay tuned in 2019….

It’s been an amazing year. Cheers to 2019!?

ON THE AIR with FUTURES with Ben Lichtenstein

My last television appearance of 2018 was on the TD Ameritrade Network a few weeks ago. With the Bank of England (BoE) meeting on monetary policy this week, as well as the Federal Reserve, I thought it was a good idea to revisit some of the themes I discussed with Ben Lichtenstein on FUTURES.

The Brexit deal was certainly on the top of discussion but so was the U.S. dollar. The Federal Reserve is so highly expected to raise interest rates for the last time in 2018 but also give dovish guidance for monetary policy next year that the market is already headed into the event selling the USD. But I believe that this selling in the USD is merely market positioning for a very specific reason that is not being talked about right now. Watch the full interview below.

Lydia on TDA Network

ON THE AIR with F.A.C.E.

Last week, I had the pleasure to be back on the air with Dale Pinkert and the Forex Analytix Community Experience (F.A.C.E.) audience. We talked all things sterling as we always do. But I also spoke on persistence and patience in trading (especially in this market environment) as well as my thoughts on equity markets as we head into the end of the year.

Check out the full interview below. Enjoy!