fbpx

Bitcoin Reaches 2023 High at $37,200

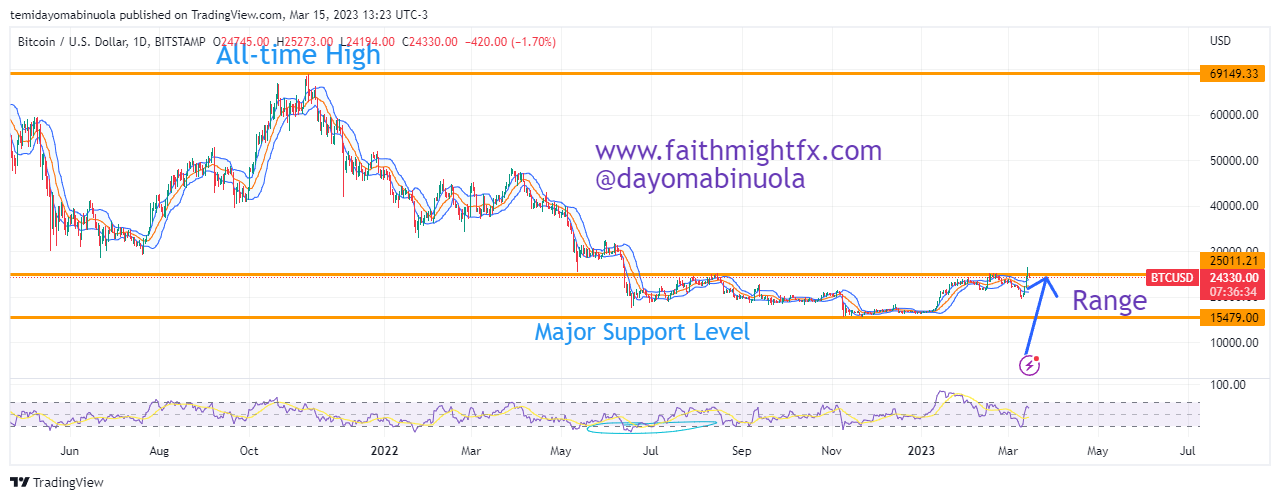
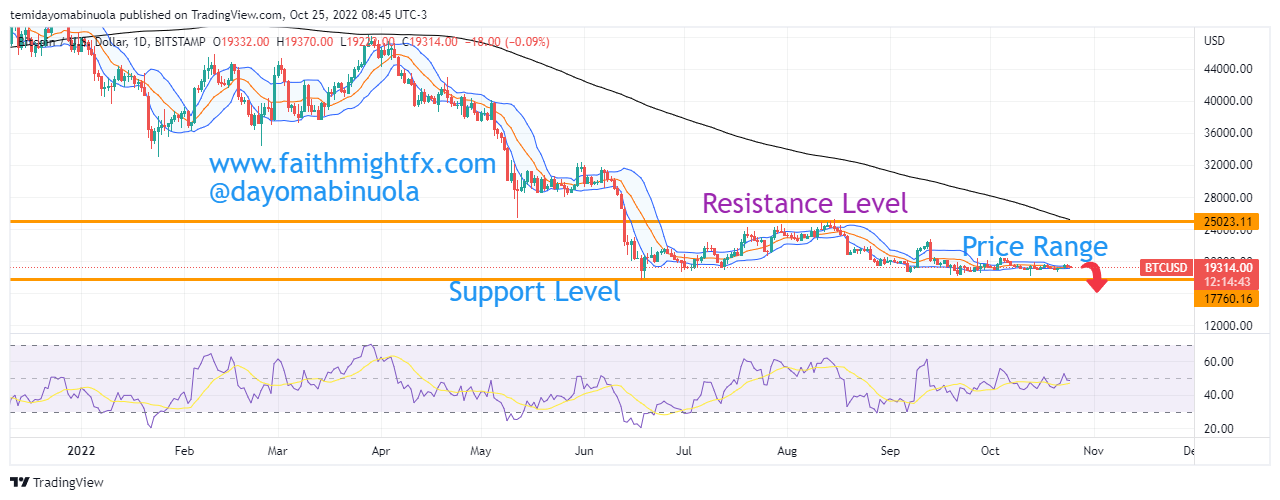
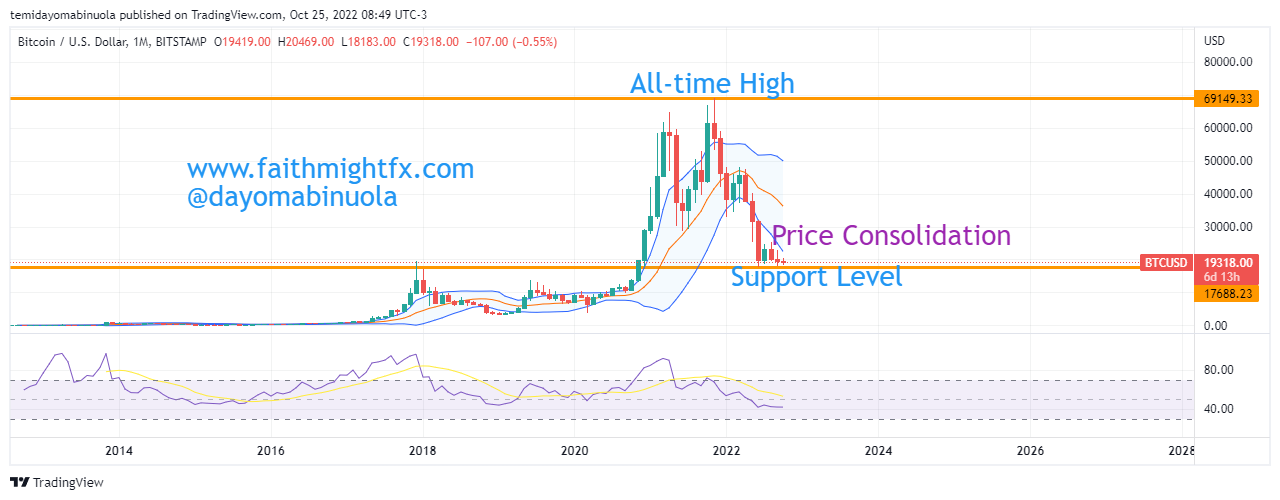
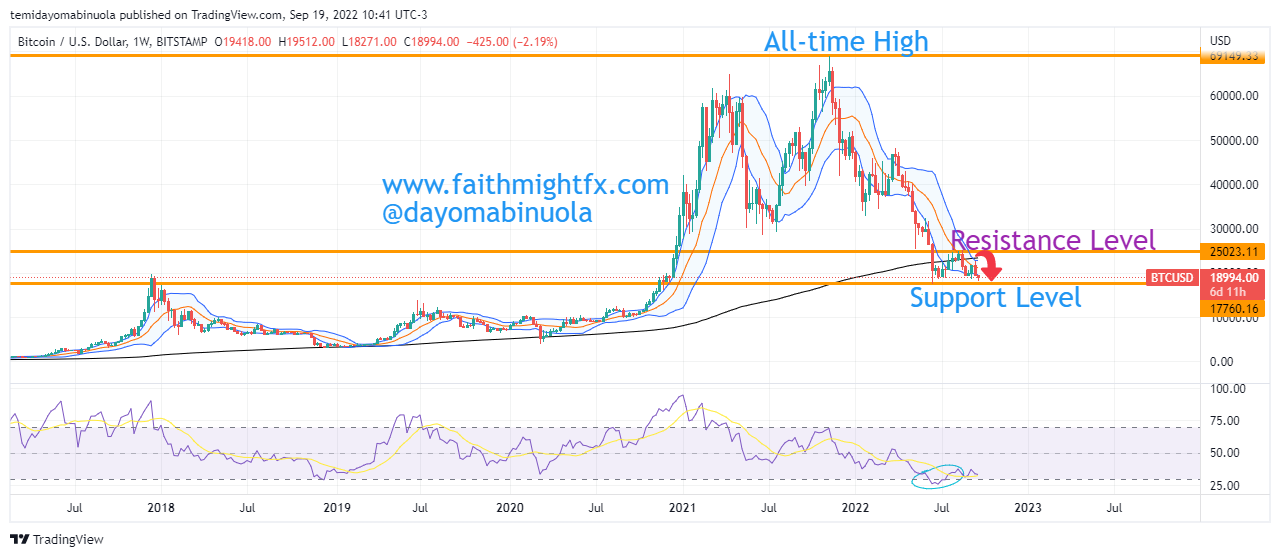
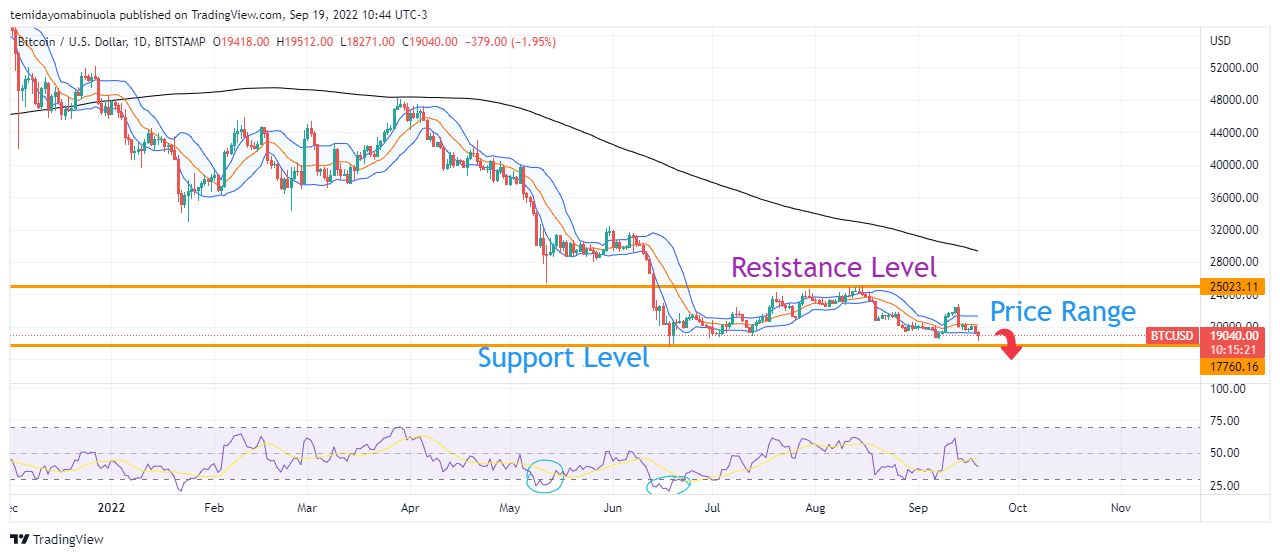
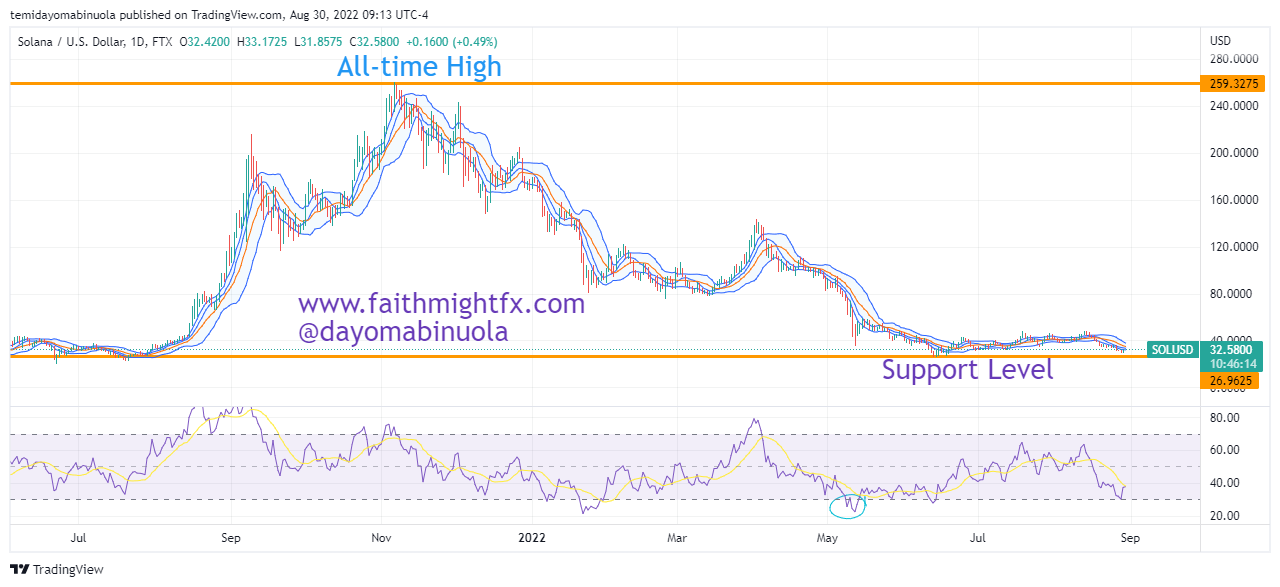
After the major crypto market dip in 2022, it has been challenging for the crypto bulls this year has there have not been a significant price movement either to the upside or the downside as price has been between $20,000 and $31,500.

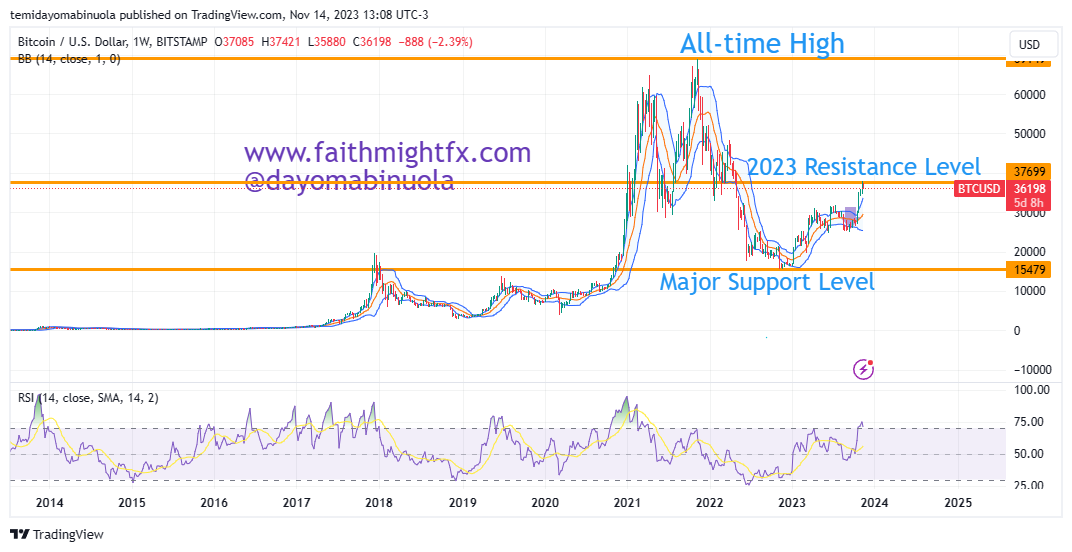
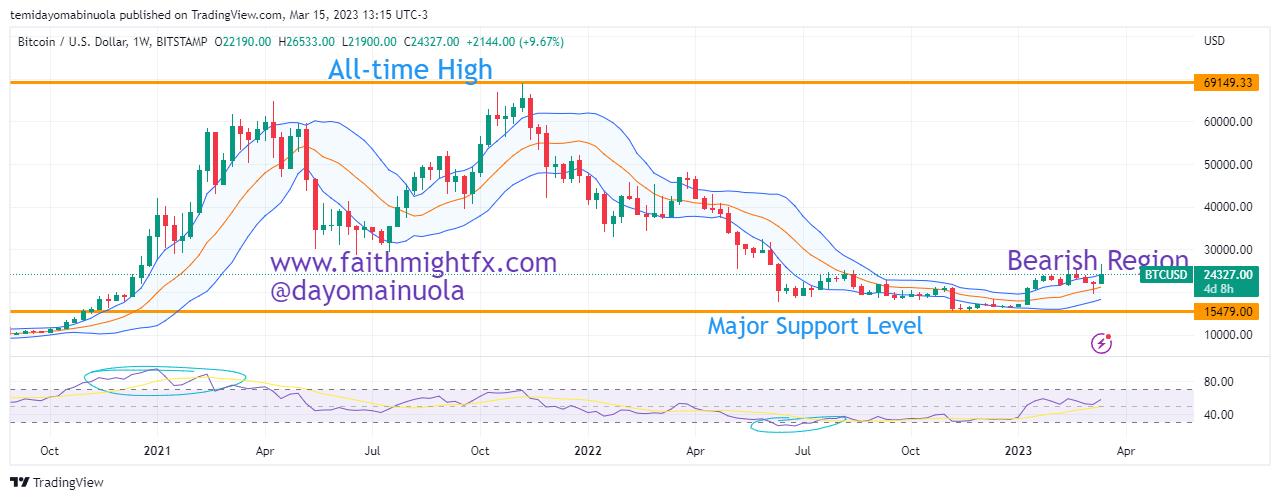
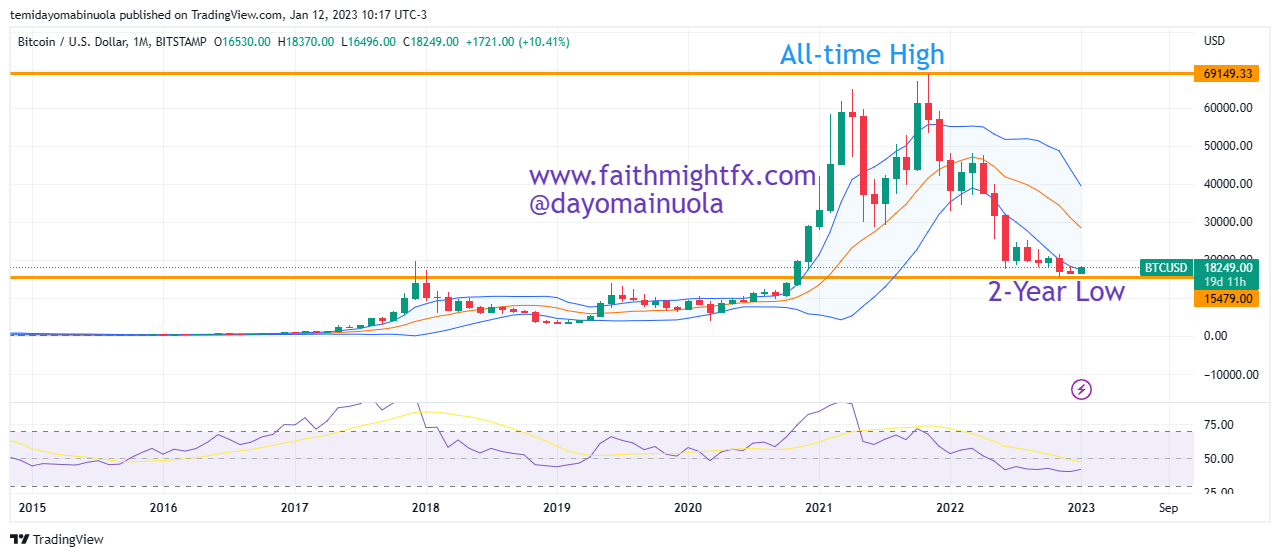
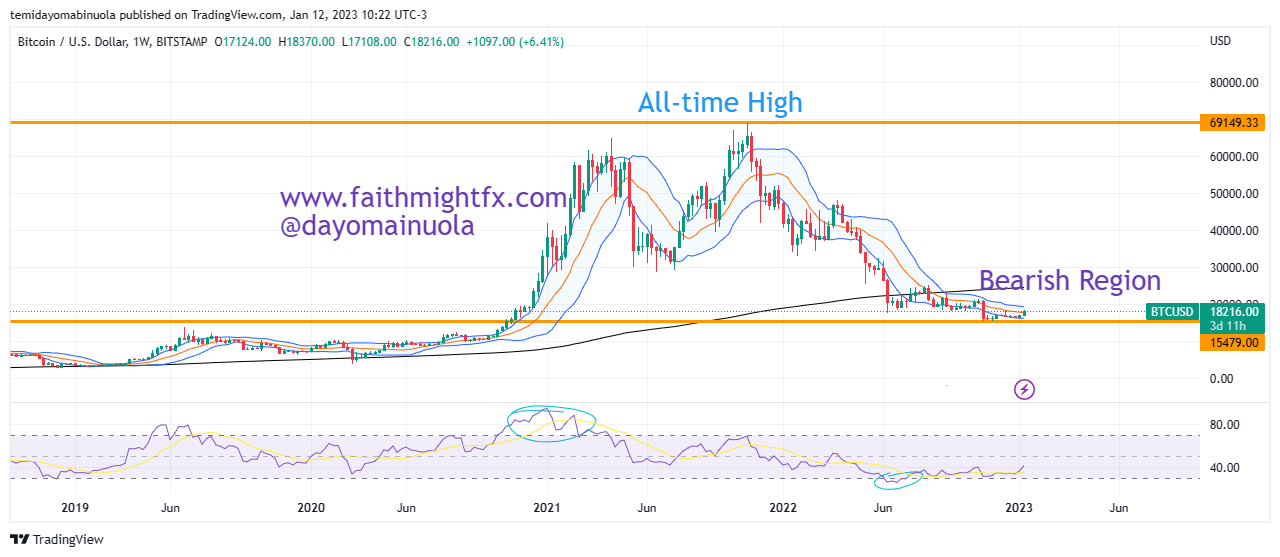
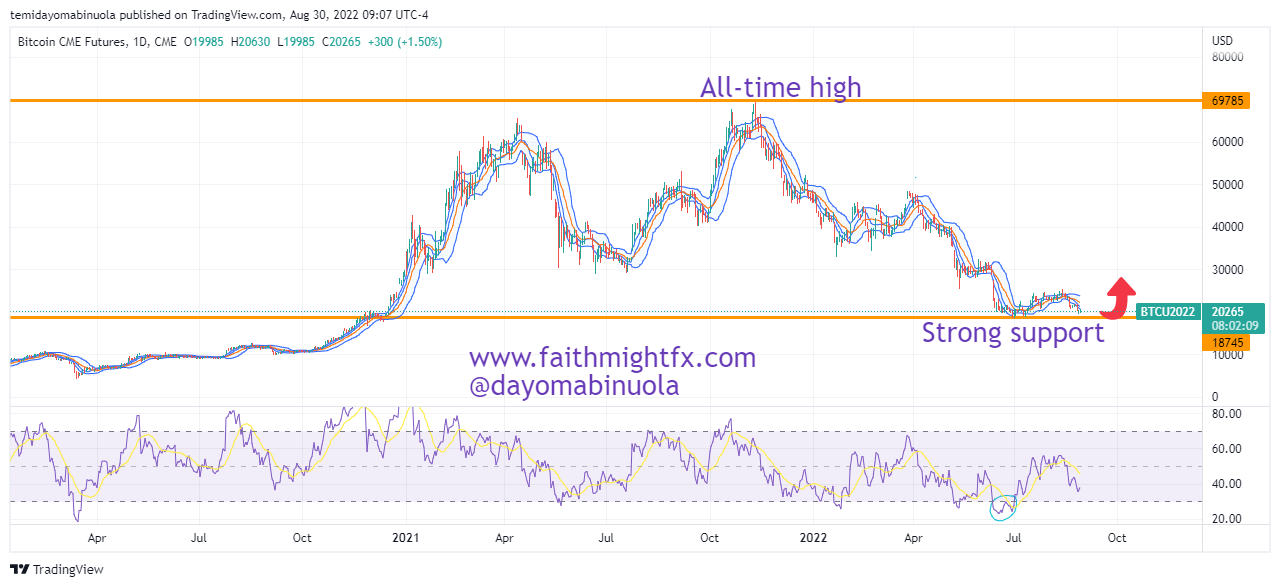
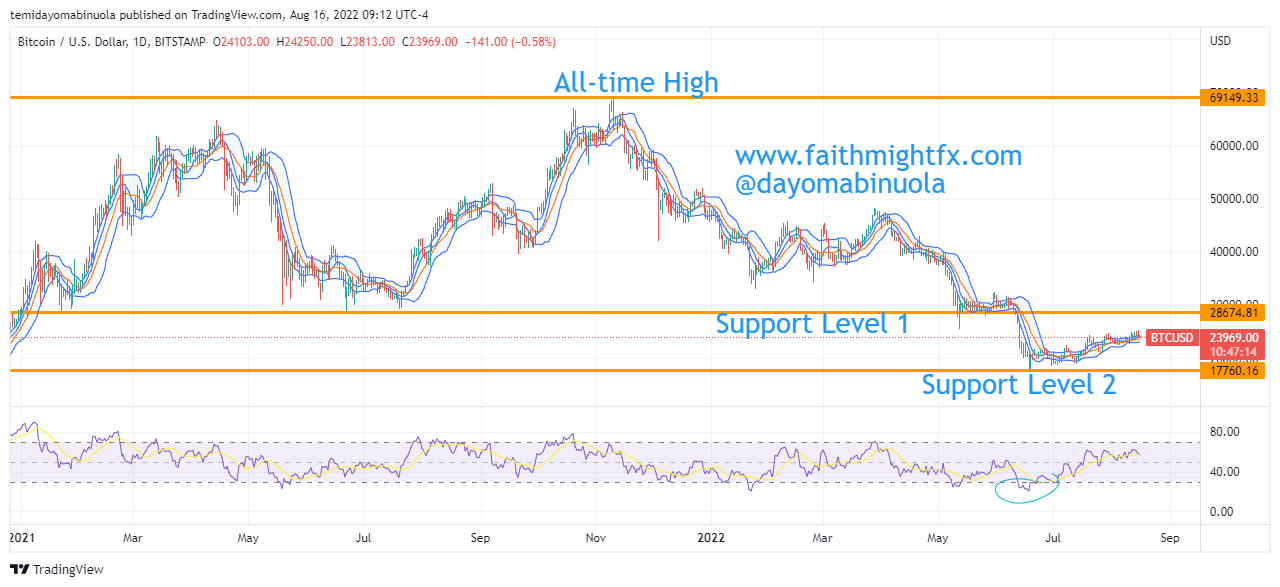
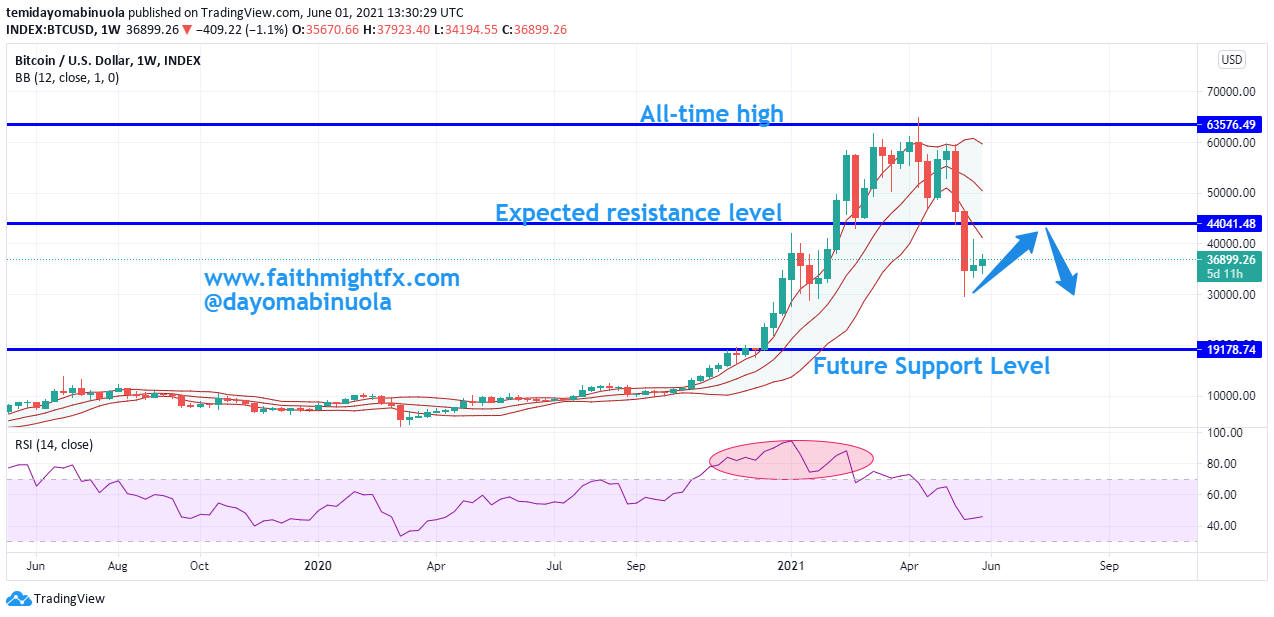
From November 2021 when price of Bitcoin reached an all-time high at $67,500, the bears were in charge of the market for one year. In November 2022, the price reached $15,479. That is approximately 77% fall. The opening price of Bitcoin in 2023 was $16,519, which was higher than the support of 2022 at $15,479. This is an obvious indication that 2023 started bullish. January 2023 was majorly bullish as the monthly closing price was at $23,081. The rally continued in February as price hit a new 2023 high at $25,000. From March 2023 to October 2023, the price of bitcoin ranged between $24,700 and $31,800.

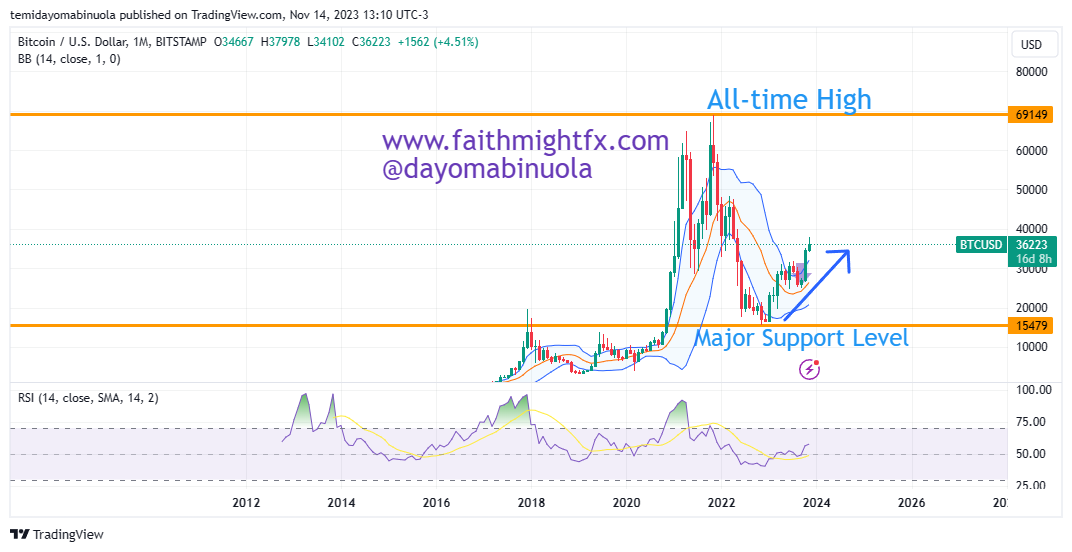
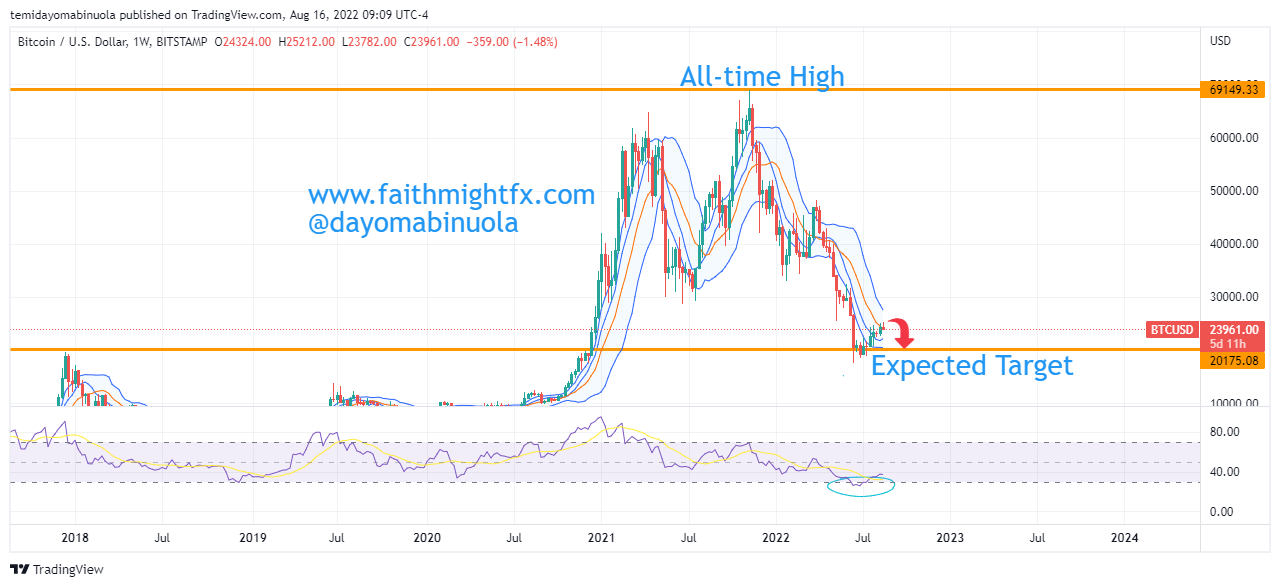
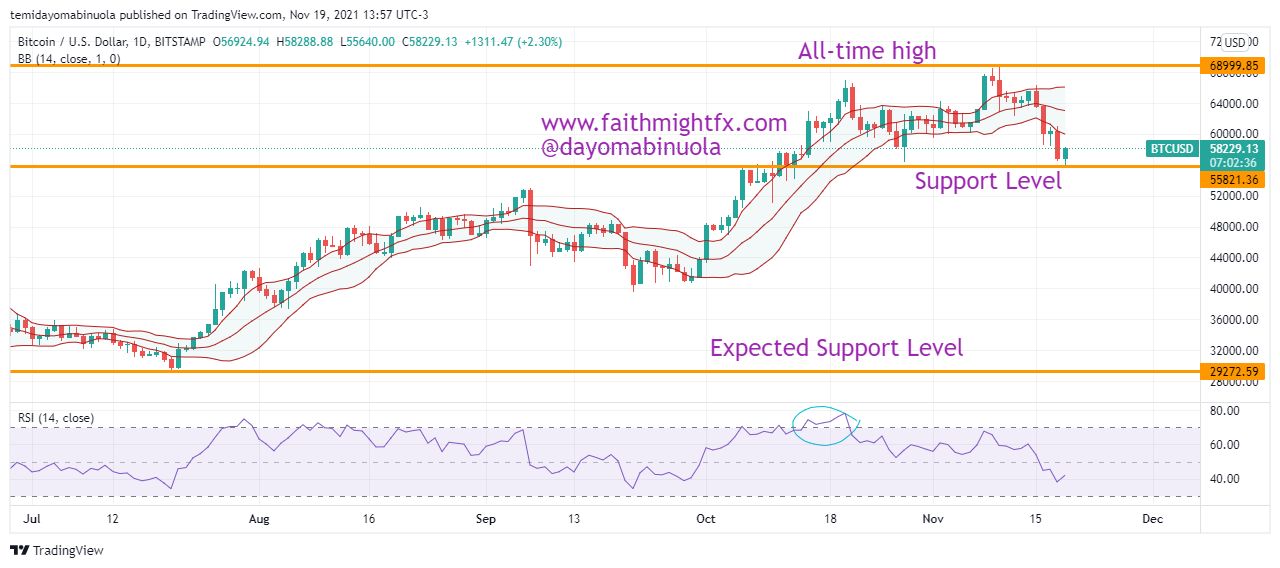
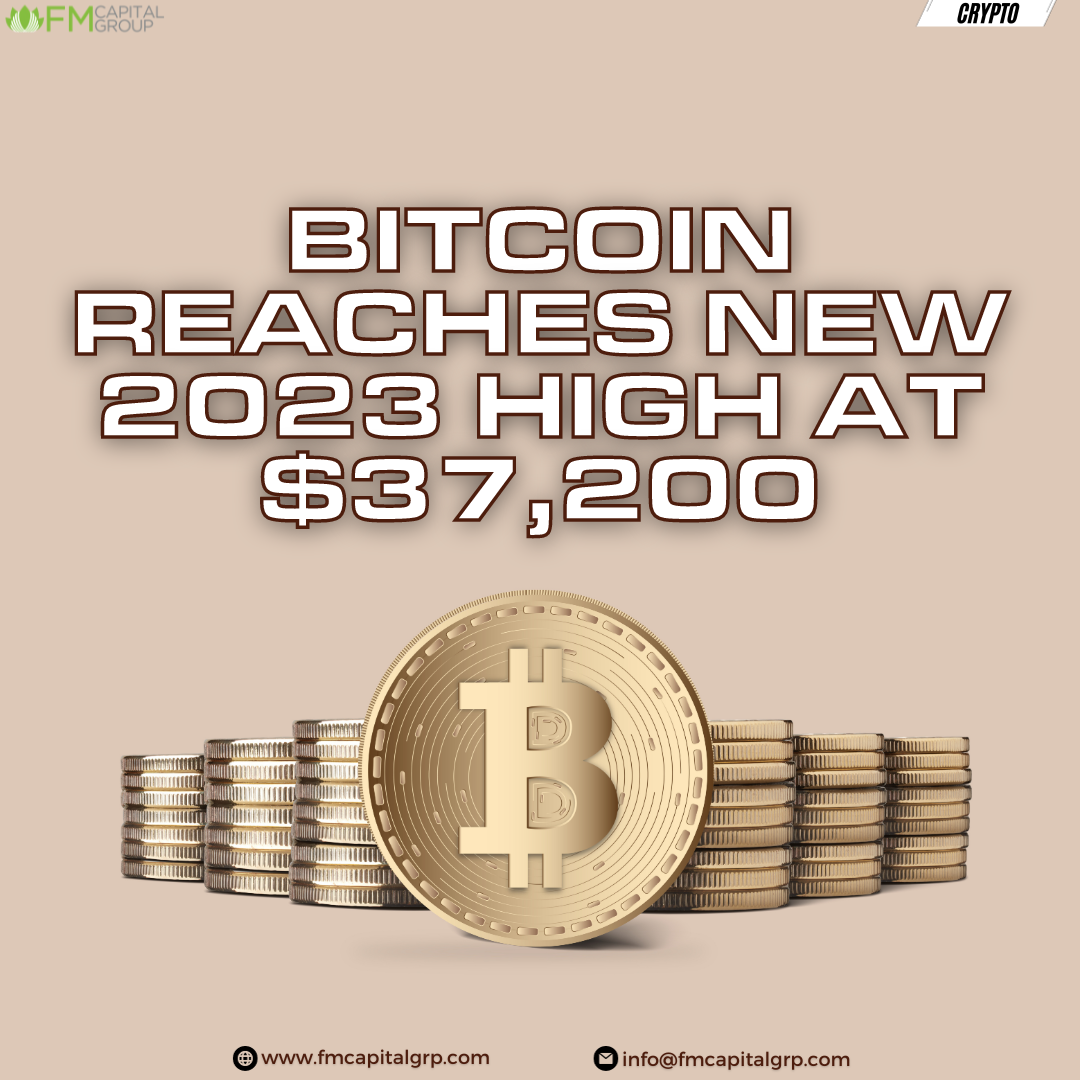
In the first week of November 2023, there was a breakout to the upside as the price of Bitcoin reached at new 2023 high at $37,880. There might be a continued bullish run to a new 2023 despite the as price of Bitcoin is currently overbought on both daily and weekly charts.

Some of these ideas are in our clients’ portfolios. To understand if this one can work for you or for help to invest your own wealth, talk to our advisors at FM Capital Group. Would you like more information on how to get cryptos in your portfolio? Schedule a meeting with us here.

Bitcoin Falls Below $22,000

Bitcoin Falls Below $22,000

Bitcoin has been in a range between $15,470 and $18,373 since November 2022. A breakout to the upside occurred on the 13th of January, 2023. Since the breakout, the pressure from the bulls have continued, causing January to end on a bullish note.

Daily Chart

The bullish run continued in February and the price of Bitcoin hit a new high at $25,200. After this, the price fell to $19,560 but then the bulls took control again and price headed to $26,530. From a technical standpoint, the bulls are gathering momentum for a major bull run.

Weekly Chart

Looking at the RSI, price has been oversold since July 2022 on the weekly time frame. As of the time of publishing this article, Bitcoin is at $24,700. Our analysts forecast that in a few weeks, price will reach $30,000 psychological level.

Some of these ideas are in our clients’ portfolios. To understand if this one can work for you or for help to invest your own wealth, talk to our advisors at FM Capital Group. Would you like more information on how to get cryptos in your portfolio? Schedule a meeting with us here

Bitcoin Hits 4-Week High

Bitcoin hits 4-Week High

2022 was not a good year for Bitcoin investors. The opening price of the year was $46,184 and the year ended at $16,523. This was about a 64% loss in the value of Bitcoin. On the daily chart, Bitcoin experienced lower highs and lower lows. The highest point Bitcoin reached in 2022 was $48,185 which was in March.

Daily Chart

Bitcoin opened in 2023 at $16,538. Studying the technicals, it is clear that the price of Bitcoin has been ranging between $15,880 and $21,500 since November 2022. As the year 2023 began, Bitcoin saw a brief rally to $17,400 which stands as the 2023 high, and simultaneously the highest point in 4 weeks. 

Weekly Chart

However, looking at the entire year of 2022, Bitcoin is currently experiencing a weak bullish momentum as the bears are still in control of the crypto market. If BTC price tries to rally from the current price of $17,287, it might be counteracted by the aggressive bears and price may fall back to the support level of $16,000.

Some of these ideas are in our clients’ portfolios. To understand if this one can work for you or for help to invest your own wealth, talk to our advisors at FM Capital Group. Would you like more information on how to get cryptos your portfolio? Schedule a meeting with us here

Bitcoin Bears To Stay Dominant

Since the all-time high for Bitcoin has been reached in November 2021, Bitcoin price has dipped heavily. BTCUSD has lost 72.1% of its value from the all-time high at $69,149. As of today, 25th of October 2022, price is around $19,292. The Bitcoin resistance level for the year was at $48,239, which was on the 28th of March 2022. Bitcoin had the highest market capitalization of $1.28 trillion on November 9, 2021. 8 years ago, precisely on May 1, 2013, Bitcoin’s market capitalization was at $1.2 billion. There has been a monumental growth in the value since its launch in 2009 when price was at $0.0009.

Daily Chart

Just like the Bitcoin crash, most crypto assets have fallen in value. Many crypto investors are hopeful that price would appreciate before the end of the year. There are no signs or possible indications that price could rally this year. All through this year, each time the price of Bitcoin has tried to appreciate, it has been consistently counteracted by a bearish force. The year’s support level is at $17,775 which was reached in June 2022. Using the Monthly Chart, price is currently consolidating around the 2017 resistance level at $17,500. The Daily Chart has shown more of a ranging price for the most part of October 2022. We might be seeing price fall below the year’s low at $17,775, which will further reduce the value of BTC; keep in mind that the current market cap of Bitcoin is at $370.5 billion.

Monthly Chart

Some of these ideas are in our clients’ portfolios. To understand if this one can work for you or for help to invest your own wealth, talk to our advisors at FM Capital Group. Would you like more information on how to get cryptocurrencies in your portfolio? Schedule a meeting with us here

Bitcoin Set For New Low Before Expected Rally

On August 17, 2022 when Bitcoin’s price was around the psychological level of $24,000, we made a forecast that the bears might push price downwards to another psychological level at $20,000. We made this forecast against the backdrop of anticipation of a rally for Bitcoin. On the 27th of August, Bitcoin hit $20K as we had forecasted.

Weekly Chart

After this $20K mark was hit, the bears still pushed price lower to $18,500. When price hit $18,500, there was a bounce to $22,800. The bounce was not able to mature into a full-blown rally because the bears took back control and price is again below $20,000. As of today, 19th of September 2022, Bitcoin hit a 3-month low of $18,300.

Daily Chart

Altogether, it’s been a bearish year for Bitcoin. The current support level for the year is at $17,625. We might be seeing price go below this level in the next few days or at most, two or three weeks from now. If the price of Bitcoin eventually gets to a new low for the year, this might form a major support level for the next bull run to $40,000. On the weekly chart, RSI indicates that price is oversold.

Some of these ideas are in our clients’ portfolios. To understand if this one can work for you or for help to invest your own wealth, talk to our advisors at FM Capital Group. Would you like more information on how to get cryptos in your portfolio? Schedule a meeting with us here

The Next Crypto Bull Run in 2022

The cryptocurrency market as a whole has seen a bullish trend since June 2022, precisely between mid-June and mid-August. For Bitcoin, the bull run hit its peak at $25,200 on the 15th of August, 2022. For Ethereum, the peak was hit on 14th of Aug at $2030. And for Solana, the peak was hit on the 13th of August at $47. 

Bitcoin

Since these peaks were hit, the bears have moved in on the cryptocurrency market. Bitcoin took a dip to a new low at $19,500 on the 29th of August. On the same day, Ethereum and Solana hit new lows at $1425 and $29 respectively. Our analysts think that in the next few days, the price of cryptocurrencies might consolidate or even go lower.

Ethereum

However, our analysts think that in the next couple of weeks, the crypto market as a whole might be seeing its next bull run. For Bitcoin, the next rally might push the price above $45,000. For Ethereum, the next rally might push the price above $3000. And for Solana, the next rally might push the price above $100. RSI on all aforementioned crypto assets have indicated that price has been oversold on the daily chart since June. This forecast will bring hope to NFT traders as a lot of NFT assets will increase in value as a result of the next crypto bull run.

Solana

Some of these ideas are in our clients’ portfolios. To understand if this one can work for you or for help to invest your own wealth, talk to our advisors at FM Capital Group. Would you like more information on how to get cryptos in your portfolio? Schedule a meeting with us here

Bitcoin in 8-Week Bull Run

In 2021, we published two articles forecasting a huge price drop of Bitcoin. Here is the first article and the second article. In May 2022, we also published a follow-up article supporting the aforementioned forecast of Bitcoin dropping below $30,000. Price eventually fell to as low as $17,960 which has been the lowest price of Bitcoin since December 2020.

Daily Chart

From the all-time high of Bitcoin that was hit in November 2021 at $69,150 to the 2022 low at $17,960, Bitcoin lost 74% of its value following that drop in price. A bounce occurred from the 2022 low of Bitcoin which happened in June, and this has led the price to rally to $25,200, which is an 8-week high for Bitcoin. 

Weekly Chart

This rally might not be sustained as the last 3 weeks has been characterized with a lot of Doji at the top on the daily chart. Our analysts believe that price might fall again, but this time to a psychological level at $20,000. We could see this in the next few weeks. Looking at the weekly chart, RSI indicates that the price of Bitcoin is currently oversold. This oversold position might eventually lead to a price rally which could be the “shoot for the moon” that many analysts in the past months forecasted that Bitcoin will experience.

Some of these ideas are in our clients’ portfolios. To understand if this one can work for you or for help to invest your own wealth, talk to our advisors at FM Capital Group. Would you like more information on how to get crypto in your portfolio? Schedule a meeting with us here

UNCHARTED Podcast: Episode 4

CRYPTOCURRENCY: An overview of the Crypto market
CRYPTOCURRENCY: Analysis of Bitcoin & Ethereum

In this podcast episode, we did a general review of markets. First, we extensively discussed Cryptocurrencies. We looked into Bitcoin and Ethereum and the recent stagnation. We also did a forecast of the direction that these major Cryptos may move in the coming months. We touched on Solana and the impact Bitcoin has on all cryptocurrencies. Here’s a forecast on Bitcoin we made some months back.

CURRENCIES: The Impressive Run of the US Dollar and how Risk-Aversion is contributing to it
CURRENCIES: Depreciation of world currencies and their reliance on the USD
CURRENCIES: US Dollar as a Safe Haven, GBPUSD, & NZDUSD
CURRENCIES: Possible causes for USD rise and Inflation
CURRENCIES: US Economic Strength and quarter-over-quarter GDP growth
CURRENCIES: Recession Fears & USDJPY

We also took a dive into the world of Currencies, specifically the United States Dollar. The Dollar has been dominating the world of currencies. Despite inflation rates being sky high, the Dollar seems to be doing relatively well when compared with other major currencies. We also discussed the Central Banks and their reactions to the inflation their respective countries face.

COMMODITIES: An overview of Gold & Silver
COMMODITIES: USD vs Gold, which is the Safe Haven of Choice?

We closed this episode on Commodities. During times of crisis, it is expected that people will hedge their funds in Precious Metals but this isn’t what we are seeing. Investors are hedging their funds in USD and investors from emerging markets also see USD as a safe haven as opposed to Gold and Silver.

Some of these ideas are in our clients’ portfolios. To understand if this one can work for you or for help to invest your own wealth, talk to our advisors at FM Capital Group. Would you like more information on how to get stocks in your portfolio? Schedule a meeting with us here.

Some Analysts Said ‘Bitcoin To The Moon’

Despite several forecasts of BTC to reach $100,000 or $200,000, BTC has failed to reach $70,000 with the recent bull run. BTC reached an all-time high at $68,999 on November 10, 2021. Most times when Bitcoin dips, other cryptos follow the same direction. Bitcoin had a previous resistance in April 2021 at $64,898. After the April all-time high, the price dipped by more than half as the price reached $28,764.37. This year support level for BTC is at $28, 731. A breakout of the April resistance at $64,876 was reached in October, which pushed the price to the most recent all-time high.

At two different times between September and October, the price of BTC using the RSI shows that price has been overbought. Price has crossed to the lower region of the Bollinger bands. El Salvador has adopted Bitcoin as a legal tender. Some other countries like Panama, Ukraine are in the race to adopt Bitcoin as a legal tender. In a situation where Bitcoin price drops below the price it was acquired, this might affect the economy of the countries as the purchasing power will be affected.

There are indications that the price of BTC falls below $30,000. This might be a bad one for the El-Salvador economy as it will be below the price it was initially bought. A breakout to the downside of the support level at $55,851 might push the price to $29,000.

Some of these ideas are in our clients’ portfolios. To understand which ones can work for you or for help to invest for your own wealth, talk to our advisors at FM Capital Group. Would you like more information on Investment Advisory, Portfolio Services, and VC? Schedule a meeting with us here.

THE NEXT CRYPTO BULL RUN: BITCOIN AND ETHEREUM

Since Bitcoin was launched in 2009, price has maintained a strong bullish movement with about 410,000% gain, from $0.09 in 2009 to its current price at $36,700. The current $BTC market capitalization stands at $678Billion.  Ethereum, on the other hand, is the second largest crypto with current market capitalization at $299Billion after its launch in 2015.

This signifies that most crypto assets are less than a decade. Ethereum has since its inception has been publicly accepted by Crypto traders and investors. Hence, the reason for the bullish movement. Just like other markets, the crypto market is a bull and bear market. High leverage usage must have wiped off some accounts due to greed. Currently, the crypto market is about $1.62Trillion with Bitcoin and Ethereum having over 61% of the market share. There are other thousands of cryptos newly introduced e.g. Ripple, Dash, Tether, Litecoin, Cardano etc. all of these make up the remaining 39% share of the crypto market.

Bitcoin, in June 2020, was below $10,000. As at today, Bitcoin is above $36,000. Ethereum in June 2020 was below $300, the price of Ethereum today stands at $2,600. In the last one year, Ethereum has done far better than Bitcoin in investment gains. Both Bitcoin and Ethereum reached an all-time high in 2021. Ethereum reached $4,370 in may 2021 and Bitcoin reached $63,000 in March 2021. With Bitcoin and Ethereum having 61% of the total crypto market, they both have a major influence in the price movement of other coins. The increased acceptability of Bitcoin and Ethereum will determine the acceptability of other coins.

After the all time high was reached in March 2021 at $63,000, price was almost halved after it reached $31,200.

About $30,000 was wiped out in the price of Bitcoin last month, which made it the worst month in Bitcoin history with 41% lost from the highest price. Bitcoin has a very strong resistance at $43,980, a bullish breakout from this level might result in a fake out as price on the weekly chart is currently in the lower region of the Bollinger bands. The recent dip affected most of the assets in the Crypto market. Price of $BTC might rally towards $44,000, but the bears might push the price lower to reach $19,000.  If a dip occurs, this will reflect in the prices of other cryptos. The next dip might also push price of Ethereum to $1,500.