
While the market awaits 2 interest rate decisions today, first from the Federal Reserve and later from the Reserve Bank of New Zealand, I talked about the central banks last week on Benzinga’s #PreMarket Prep Show. Take a listen to why I believe the rally in the Canadian dollar is just getting started and my conflicting thoughts about the U.S. dollar. I come on at the 1:05:00 mark.
Majors Meltdown
Ivaylo Ivanov of SocialLeverage50 tweeted this sweet currency chart this morning before the US open. With 1 more day until it ends, it pretty much sums up the entire 3rd quarter of 2014.

Which surprised you the most? Sterling has been pretty resilient to the USD strength as it found favor in the face of a majors meltdown. The currencies of the G10 all melted this quarter and all to pretty significant support levels. Except for the pound sterling. Even the mega rally in the USD is at a significant resistance level. Is GBP a laggard? Or the exception? A signal of future strength in the currency? Or future weakness?
Source: Image credit
The Sterling Digest, 15 September 2014: ref talk

Of course, the only thing still on the wire is the Scottish referendum. But the Scots stand to rock the world as secessionists everywhere get emboldened by the possibility of independence. Naturally, the referendum polls are just as emotional as the voters they reflect. Sterling spiked to new weekly lows across the board as the Yes vote took lead last weekend. Then the No vote moved ahead as the trading week unfolded and sterling surged big time right back to familiar highs in all the GBP pair majors. Headed into the actual election this week, expect price to actually weaken as buyers take profit and sellers take advantage of the recent highs. Even with the Bank of England set to make a monetary policy announcement, all eyes this week are on the referendum vote. Friday, the day after the vote, will be the most interesting trading day of the week and may set the tone for the rest of the year.
- Scotland and Zanzibar share a related history and perhaps a smilier fate. (Africa Is A Country)
- The UK has issued a reminbi-denominated bond, only the 2nd eurobond in its history. It’s has to pay for this divorce somehow. (Xinhua)
- Why everyone in the world will be listening to Yellen this week. (Business Insider)
- There are 5 lessons GBP traders can learn from the Quebec referendum (Forex Live)
- Anybody remember Mark Carney saying something about raising interest rates? No? We didn’t think so. (Bloomberg, FX Agenda, Forex Live)
- In case you didn’t know, Scotland independence could have big implications (WSJ, Breaking Views, CNN Money, Telegraph, eFXnews)
- As with any trade, only price pays. Nice technical looks at some GBP pairs. (Pip Train, Dragonfly Capital, All Star Charts, FaithMightFX)
The Sterling Digest, 25 July 2014: define safe
Here’s Britain’s “top of the world” GDP performance in the appropriate context: pic.twitter.com/Ko3n43D4Q9 — Ben Chu (@BenChu_) July 25, 2014
It seems to me that the bulls are still safe. Despite the stalling at highs 2 weeks ago and the inevitable selloff this week, sterling looks well-poised to begin its move higher from current levels. The charts look great with the selloff in $GBPUSD right into 1.6950; and the rally in $EURGBP capped by 0.7950. If these areas of support for sterling hold, it could be off to the races as sterling pushes higher again. But has there been a fundamental change that would support further GBP weakness? This rally has been fueled, first, by economic growth and, now, by interest rate hike expectations. The market will, however, pay attention if the data misses reported throughout this month become a trend. And such a trend will temper the market’s expectations for interest rate hikes. What happens when the BoE decides instead to taper its QE program? Or if the $FED does raise interest rates? How safe really is this GBP rally? Consider it is safe for now.
- Don’t hold your breath (The Economist)
- 3 Takeaways from the BOE Meeting Minutes (Baby Pips)
- Risks to sterling may not be appreciated (FT)
- EUR Not A Safe-Heaven; GBP Is The New CHF – Morgan Stanley (eFXnews)
- Great British manufacturing is rising from the ashes (Forex Live)
- GBPUSD monthly (StockTwits)
- GBPUSD Aiming at 1.73/1.74 zone (Twitter)
The Sterling Digest, 11 July 2014: stalling

Advancement in the GBP trend has stalled this week. Manufacturing and construction data missed this week and the Bank of England’s hold on monetary policy turned out to be a non-event. Sterling weakened briefly on the policy announcement but momentum never really took hold in either direction. Dips were bought but highs were also met with enough offers to keep price capped for another week. This stalling, sideways action is simply consolidation of the bull rally that has gained strength in the past month. Now as the 1st full week of trading of the 3rd quarter comes to a close, sterling remains in a tight range. Despite the tepid price action this week, sterling remains fundamentally strong. Between the US Federal Reserve and the European Central Bank, the BoE looks tremendously hawkish. Until that contrast changes, it is enough to keep sterling supported long term.
- BoE holds fire amid fears of sterling strength (CNBC)
- Time For a Long Term Play in Cable, No the Other One (Dragonfly Capital)
- Euro/Pound extends down trend (Futures Magazine)
- World Cup lifts UK consumer spending growth to 4-year high in second quarter – Visa (Reuters)
- Household debt serious threat to UK recovery, says Bank of England deputy (The Guardian)
- Why AUD and GBP are off to a Strong Start in July (Traders Log)
- End of month thoughts: World Currencies Cup (Piptrain.com)
- Goldman: Revising Our GBP Forecast Higher & Our EUR Forecast Lower (eFXnews)
- Lydia Idem Finkley: GBP/USD buying opportunity at 1.7060 (FXStreet)
- More Dips, Same Trend (FMFX)
- Healthy Dips Make for Healthy Trends (FMFX)
The Week Ahead In Charts
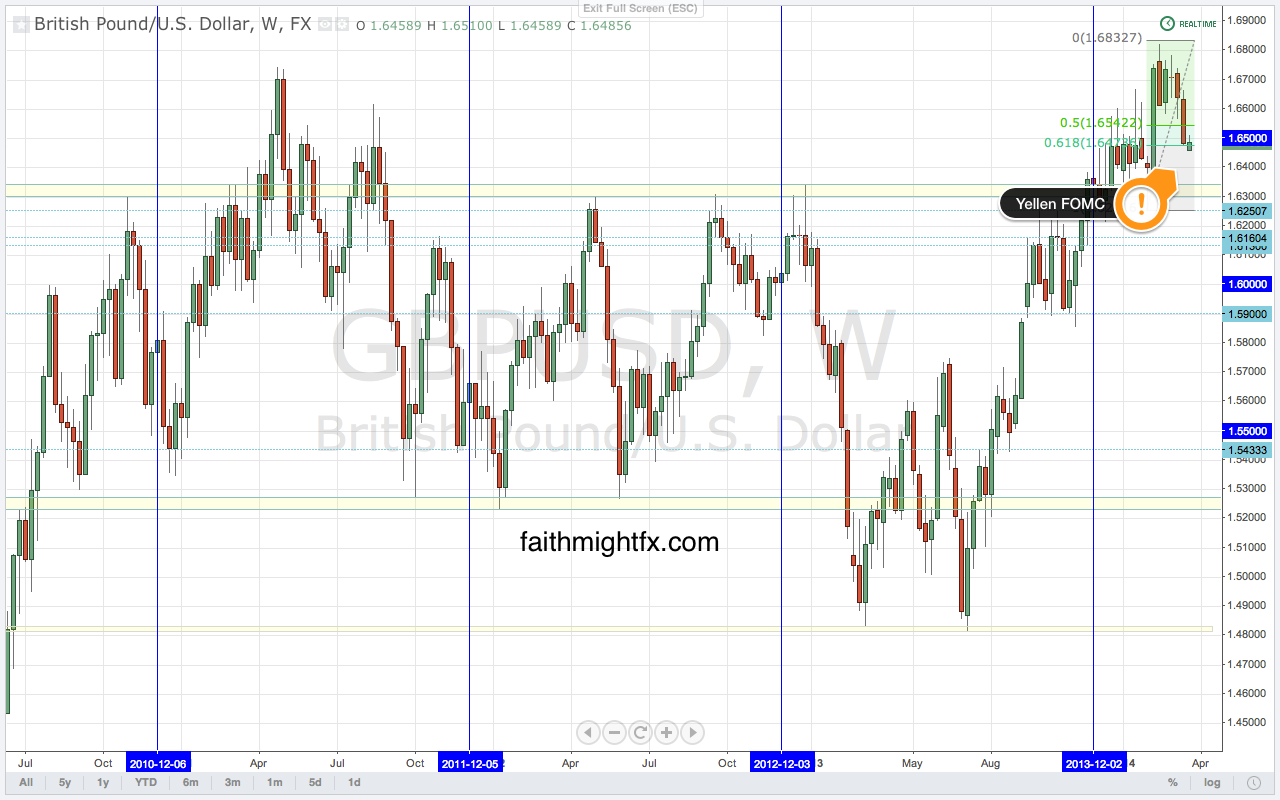
Last week, Janet Yellen changed the game. This supposed uber-dove fooled us. She came out hawkish without really rattling markets. She is reigning in the USD. Contrary to those that say she’ll retract later, markets may come to find out that Yellen is serious. She is much more hawkish than the market ever expected. Can the USD strengthen on this change?
GBP/USD
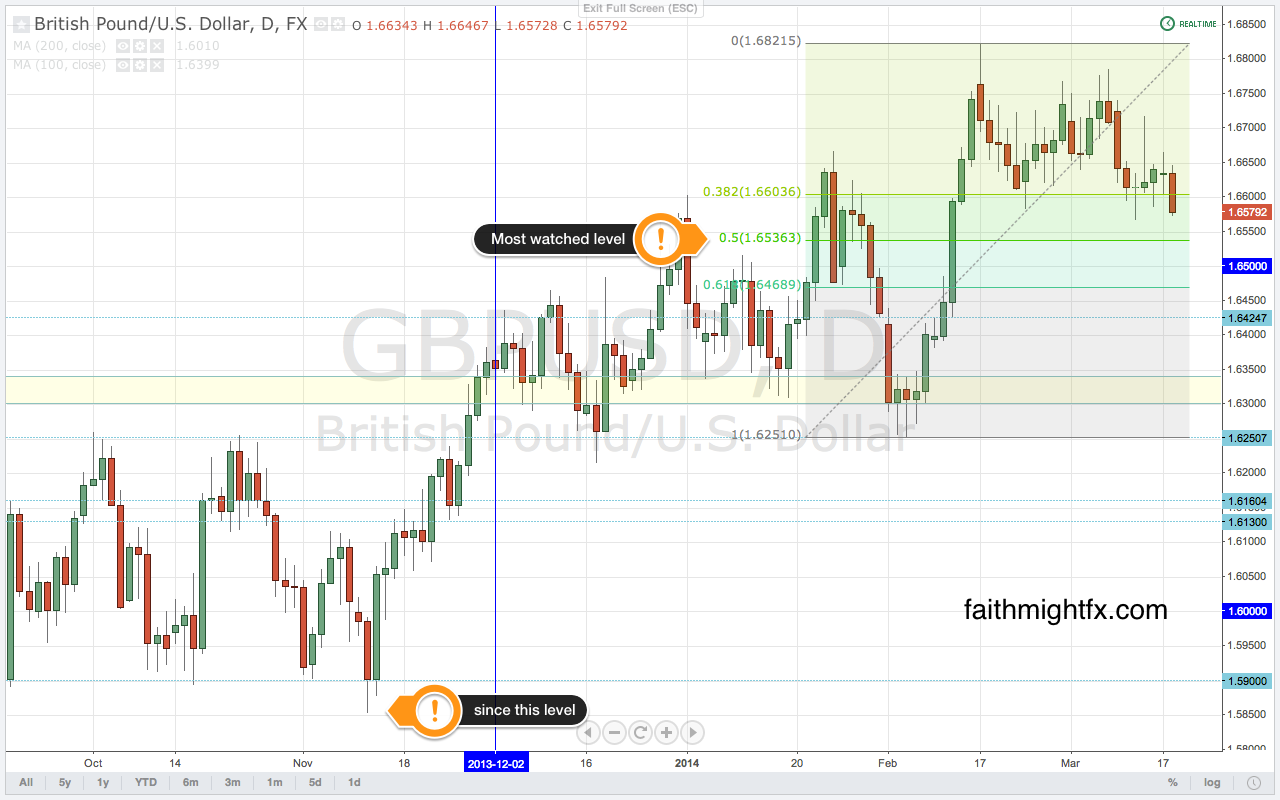
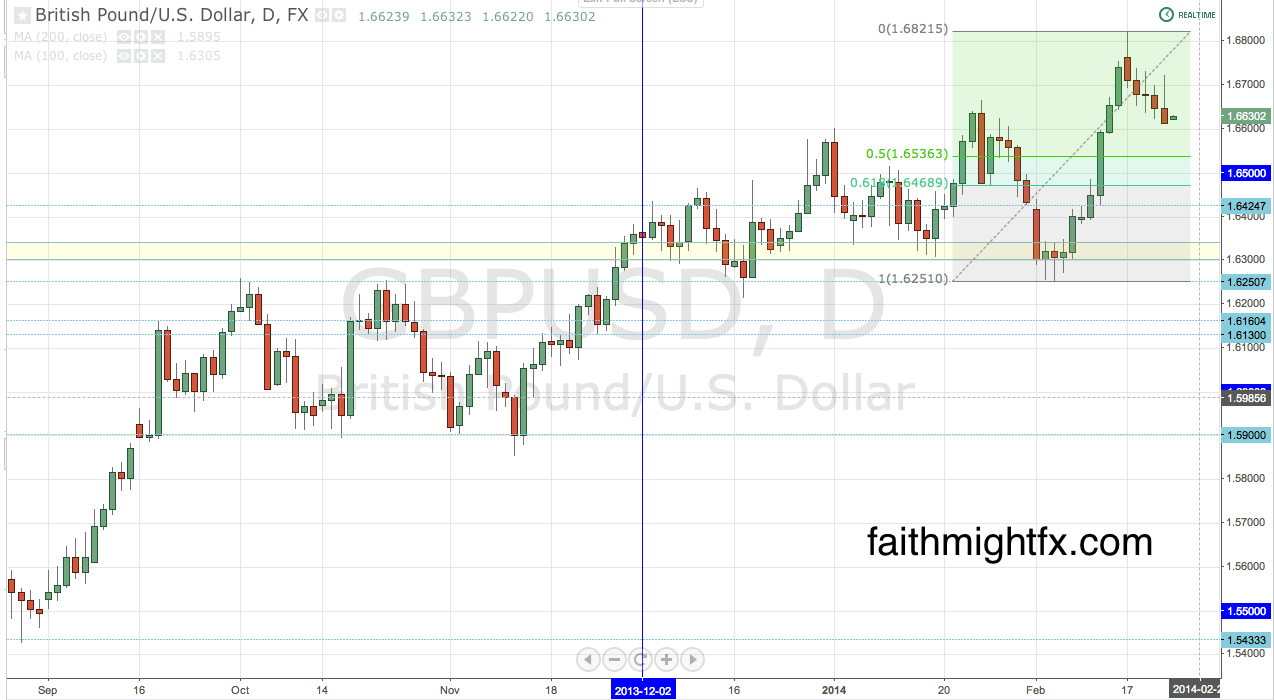
$GBPUSD declined last week to 1.65 even breaking below the big psychological level on the back of Yellen’s hawkish rhetoric last week. The technical picture looks broken as cable closed the week below 1.65 for the 1st time since January. Price breaks the 61.8% Fibonacci level at 1.6467. It looks like another failed breakout on the weekly chart. Just when cable had everyone yelling for 1.70 (even yours truly), markets once again make a sucker out of everyone. If $GBPUSD is unable to find support above 1.6500, this would signal a reversal back to 1.6250. Is the Yellen spark enough to break that level? That’s the more interesting price action for market sentiment. And the Yellen FOMC just became the 1st central banks to raise interest rates AND remove QE.
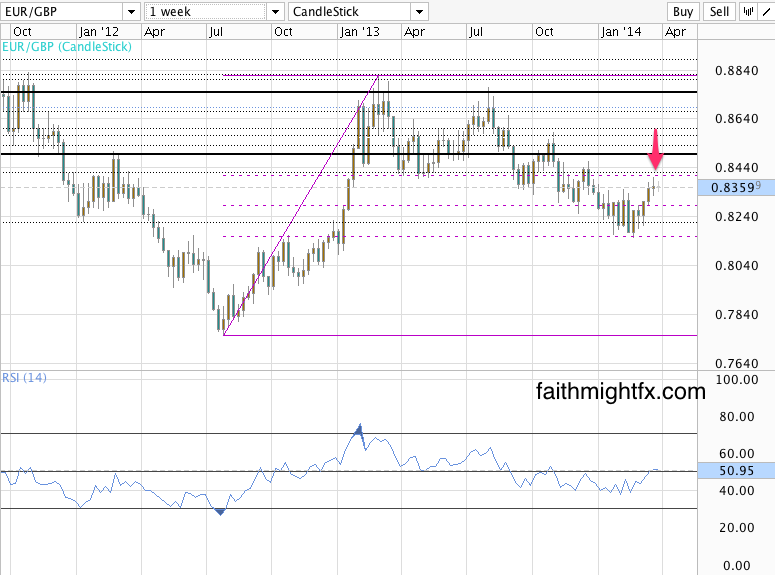
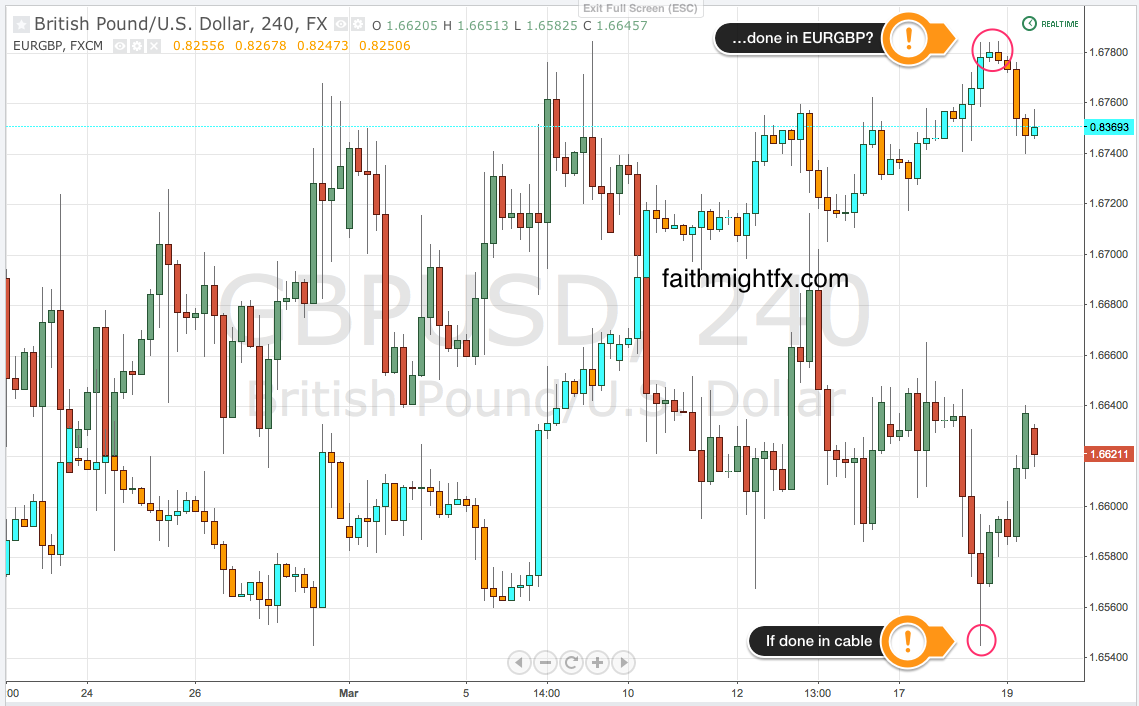
EUR/GBP
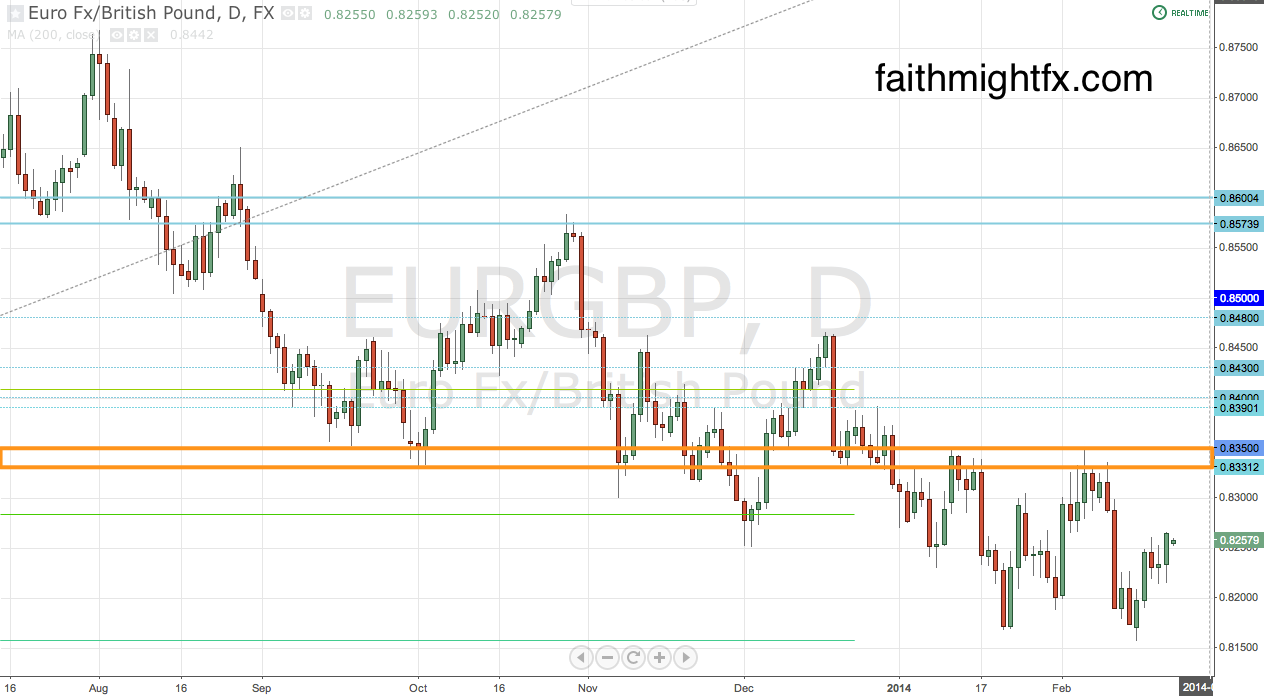
The $EURGBP has managed to stage a rally higher than expected finding resistance right at the 0.8400 level. Price now remains trapped in a range between 0.8330 and 0.8400. However, it seems that the EUR will find difficulty rallying in the face of weak economic data and a still dovish ECB. If price breaks below 0.8330, losses could accelerate back to the 0.8250. But it remains to be seen how much EUR can really rally on its own fundamentals. This may be the only currency that sterling can rally against. If 0.8250 holds then we’ll be back to these levels again with resistance at 0.8400.
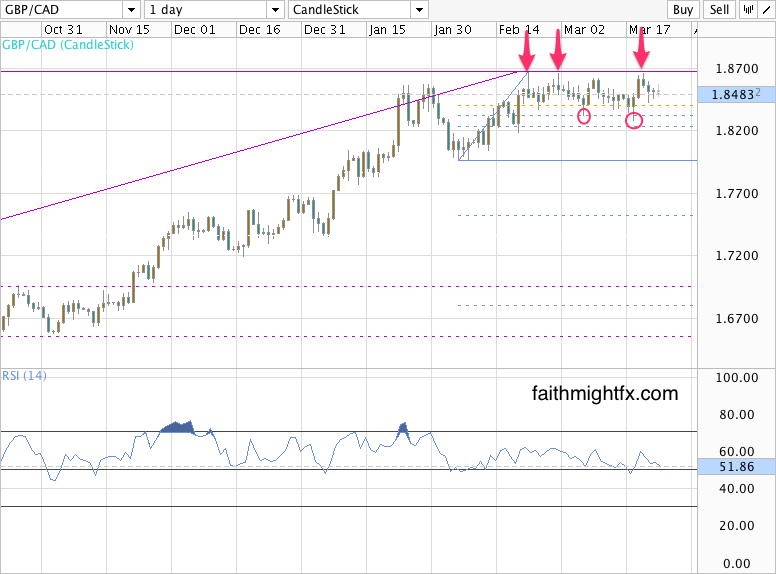
GBP/CAD
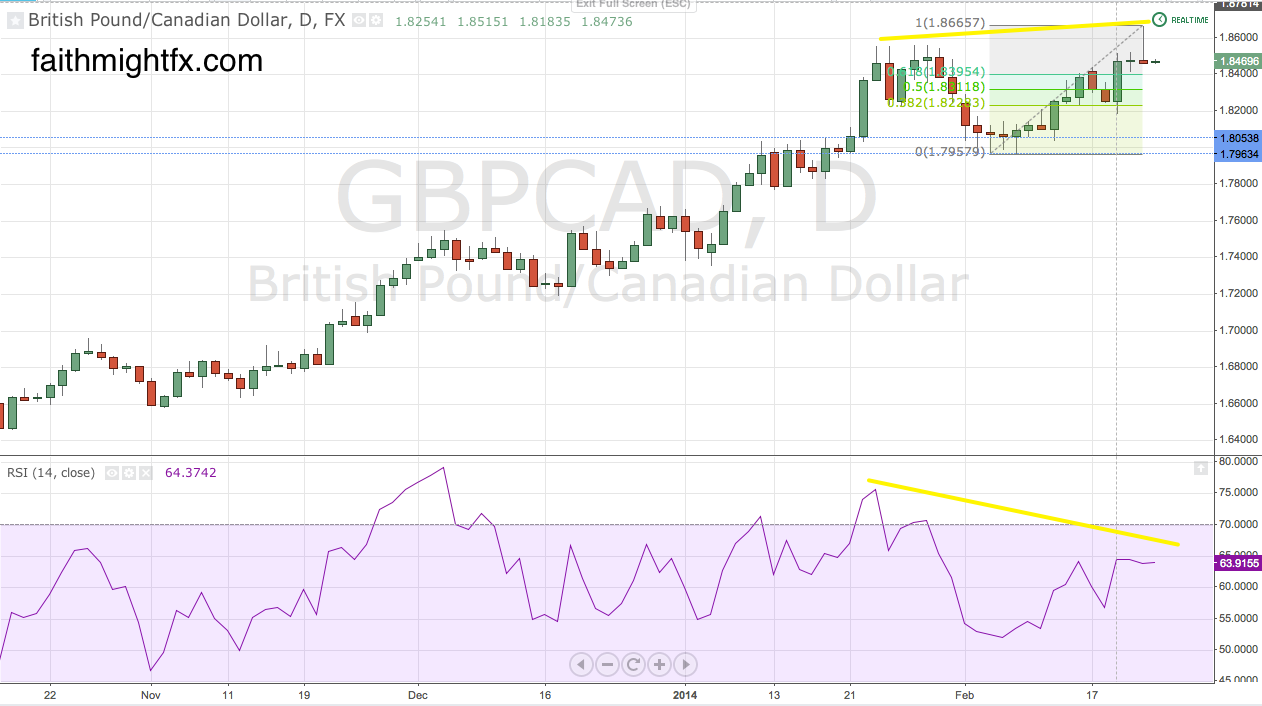
Canadian data continues to support a weak CAD which only continues to support the $GBPCAD at its 2014 highs. However, this pair is having a difficult time breaking any higher above 1.8650. Price continues to pivot around 1.8500. The fundamentals in this pair continue to favor the bulls. But can it really rally when GBP is weak in all the other pairs. I’m not so sure.
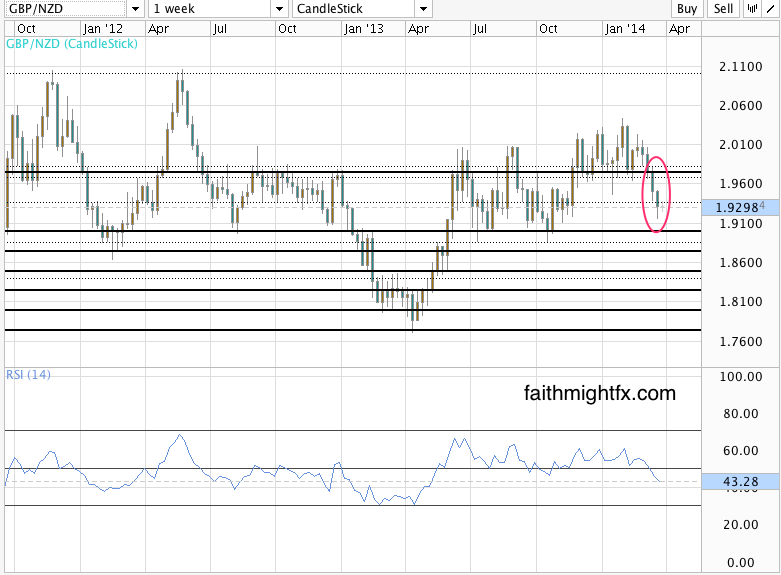
GBP/NZD
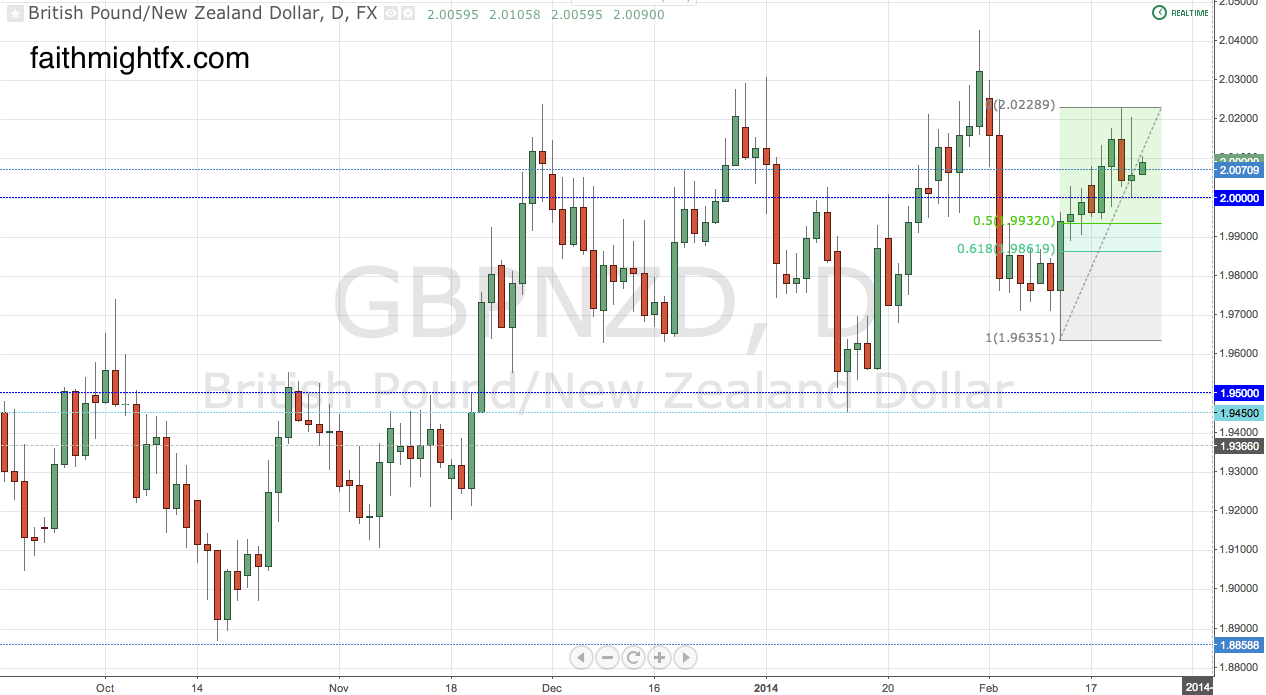
There has been a major breakdown in the $GBPNZD causing a reversal on the daily chart. During the consolidation of the $GBPUSD, the $GBPNZD was holding up quite well in its own consolidation. But the effects of the Ukraine-Russia conflict have sparked a rally in commodities and with it the NZD. As such, the correction that was taking place in the $GBPNZD and finding support at 1.9500 broke down further last week. Price managed to completely reverse this year’s rally moving to back to lows on the daily chart. The level to watch is 1.9100. A break below moves prices toward 1.9000 with major support at 1.8850. However, if price finds support at 1.9100 then it moves back to 1.9500. Watch out also for intervention from the RBNZ if the NZD continues to find strength.
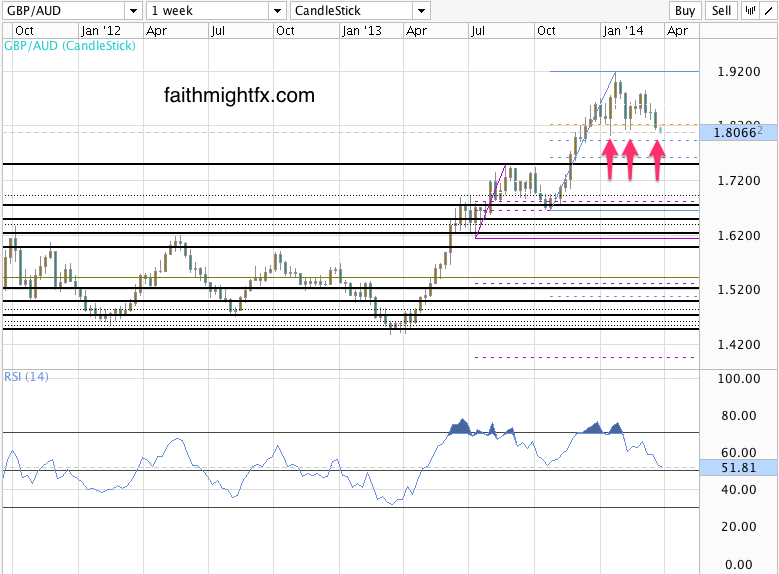
GBP/AUD
The $GBPAUD is benefiting even more from the rally in commodities even as the Chinese economy, Australia’s biggest trading partner, continues to slow. There is also a massive head and shoulders chart pattern on the daily chart that many traders are looking to resolve to even lower levels. Based on this chart pattern, price could decline to 1.7600 which is the huge 61.8% Fibonacci retracement level on the weekly chart. Even a 400-pip decline from current levels wouldn’t change the bullish bias on the long term chart. But will the RBA allow the AUD to strengthen that much? RBA intervention is a real possibility if $GBPAUD breaks this support at 1.8000.
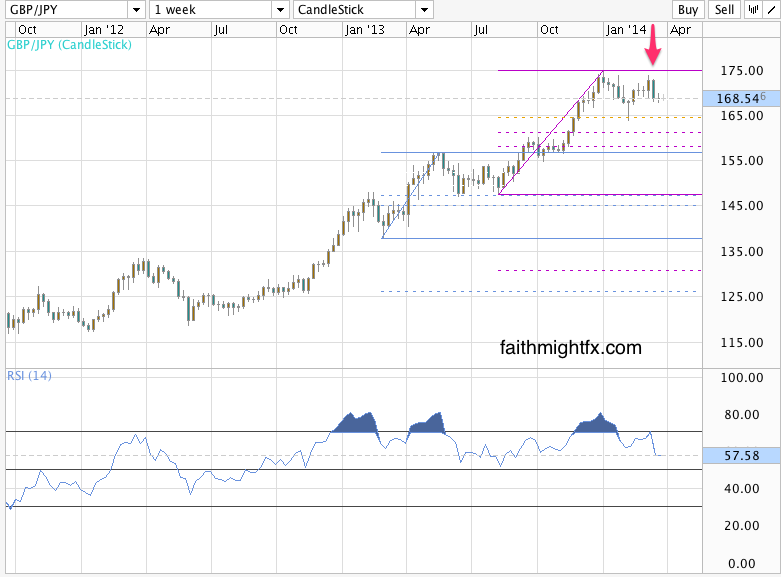
GBP/JPY
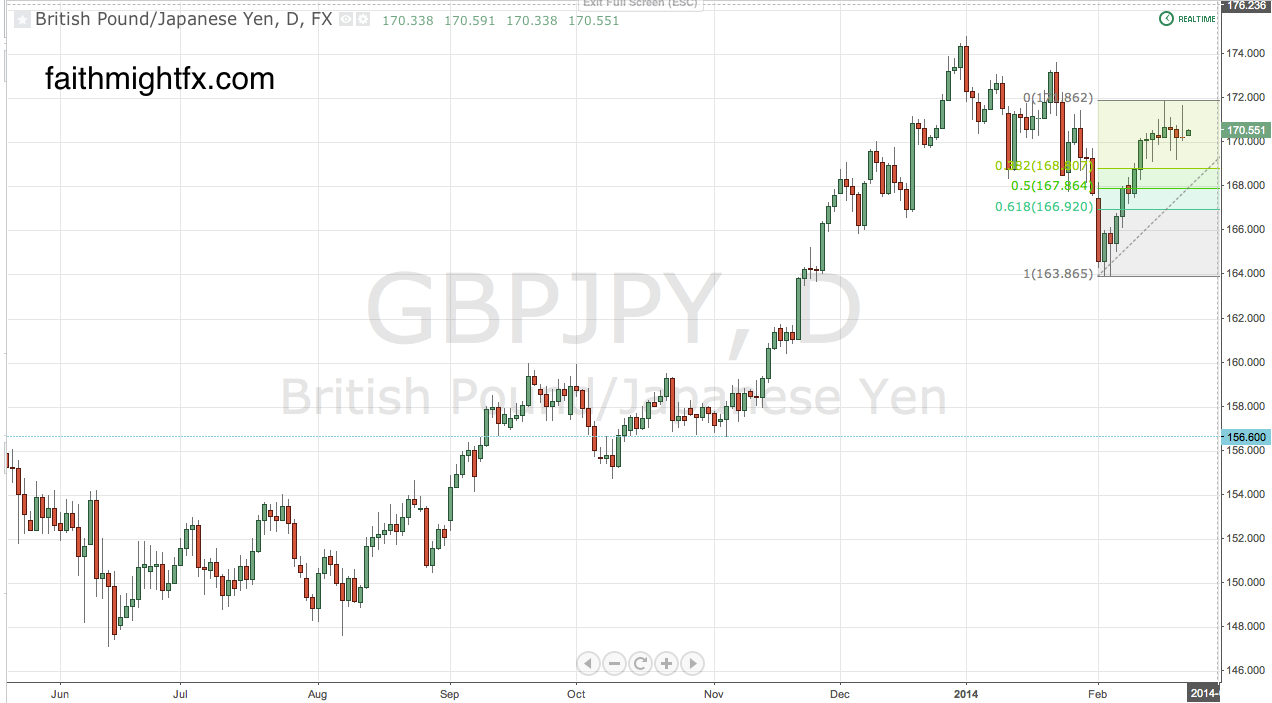
Despite the bull trend on the daily chart, $GBPJPY has fallen below the big psychological level at 170.00. Even while the pair is finding support at 167.50, a break below 167.30 signals a price move to 163.80/164.00 support. Only a close back above 170.00 can change this new bearish sentiment in the $GBPJPY. A move lower will be choppy as the bull trend no doubt still has many buyers with the $GBPJPY still only in a shallow retracement.
Sterling Digest – crosses firm up
Yesterday, $GBPUSD fell to new lows just pips ahead of the 50% Fibonacci level at 1.6536. It was the move many of us had been waiting on for weeks. Now that the consolidation in $GBPUSD is finally over, I believe we will see GBP resume its rally in many of the major pairs. The UK fundamentals have been there and the strong recovery is its reality.
However, what is interesting is the reversal that is beginning to confirm itself in the comm doll pairs. I expected these pairs would weaken to key support levels. However, this week, for the 1st time in months, those support levels are being broken. We may be on the cusp of D-Day where swing buyers start to sell and bail out of the market. OR. It could be an incredible buy opportunity because of the BoE minutes and FOMC announcements this week.
- The BoE minutes are out and they are hawkish. (eFXnews)
- I saw it too but it never counts unless you publish. These guys were 1st to show this incredible H&S in $GBPAUD. HUGE level. (Twitter, Factor)
- The $GBPNZD put in a huge level too. While I thought 1.95 was key, 1.9150 proved to more significant. (Twitter, FMFX)
- Raising interest rates vs. tapering QE — interesting take (Telegraph)
- The huge bounce off support in the $GBPCAD this week very nicely reflects a dovish Bank of Canada and overall weakness in Canada versus a hawkish Bank of England and robust UK. (Ashraf Laidi)
- A review of the $GBPUSD move we have been waiting on all month (FMFX)
Sterling Digest – bulls underneath it all
Low inflation has given the BoE the space to keep monetary policy easy as is. That, in turn, supports the economy which is running very robustly. The market has had every reason to be bullish pounds as the UK recovery has proven to take root. $GBPUSD has come off its new highs but still only in a shallow retracement. It’s been a chop fest as cable slides but trades in a range between 1.6750 – 1.6580. This choppy correction is only indicative of the strong bull trend that is in place. I suspect that cable continues lower to find support around 1.65. But I’ve been piping on this for weeks. I guess that means by now all the algos know too.
- Yes. I have been a broken record about this consolidation pattern in $GBPUSD. (FMFX, FMFX, FMFX)
- I couldn’t disagree more with UBS. But retail vs. institutional is nothing new. (eFXnews)
- While I agree with JPM, I’m more bullish than they. (eFXnews)
- Nouriel Roubini is hawkish on the BoE. Is this a contrarian signal to the upside? (Forex Live)
- The fundamentals in the UK are phenomenal. Bad weather be damned. (CNBC)
- I like this long term look at cable. Good stuff. (BruniCharting)
The Week Ahead In Charts
After a week of consolidation in sterling, GBP pairs are a mixed bag as this new trading week gets underway.
GBP/USD
Though $GBPUSD has moved off its recent multi-year highs, it has been a volatile and choppy ride lower. Expect more of the same again this week, as this pair continues to correct lower towards 1.6500. I believe big time buyers are set up all around 1.65 between the 50% and 61.8% Fibonacci retracement levels. A move from these levels supports a rally to 1.7000 mid term.
EUR/GBP
The $EURGBP spent all last week struggling at the 0.8250 level. On Friday, however, price broke above 0.8250 and held the level to close the week. While the daily chart is in a clear downtrend, price is holding support at the weekly chart’s 61.8% Fibonacci retracement level. This correction has the potential this week to continue higher to the zone between 0.8330 and 0.8350. From here, it will be decision time. But the odds are with the bears as GBP could catch another bid and push price back to lows.
GBP/CAD
While $GBPUSD and $EURGBP consolidate, the $GBPCAD price action has remained bullish . Candaian fundamentals keep the $GBPCAD well supported on dips. Dips due to GBP weakness have been bought below 1.8500 as CAD fundamentals continued to deteriorate. For some reason the Canadian economy is falling into recession even as the US, its largest trading partner, has remained robust. This pair will continue to have issues getting higher as long as cable is weak. Once $GBPUSD starts to show strength again, the $GBPCAD should find conviction higher again.
GBP/NZD
The $GBPNZD has remained very bullish closing the week above the almighty 2.00 level. As the $GBPUSD continues its consolidation lower, there is major positioning occurring at this major psychological level in $GBPNZD. It has been a whipsaw at the highs but as long as the overall GBP bull trend remains in place, this pair is poised for 2.05 mid term.
GBP/JPY
The $GBPJPY has remain elevated as equity markets bounced higher to the 2014 resistance levels. This week, all eyes on US stocks and emerging markets as 2 wars ended this weekend. The stage is set for risk to rally higher as geopolitical events turn towards peaceful resolution. As $GBPJPY opens this week above 170.00, the bullish sentiment favors buyers even as the trend still remains corrective below 175.00.
All these charts suffice it to say that sterling is smoking hot. A trend that can correct is only headed higher. And a trend that holds up during consolidation has the makings for a major breakout. $GBPUSD is the pair to guague timing in the GBP crosses during this time of consolidation. Once major levels are reached in cable, sterling may rock out across the board once again. Or not. Price will ultimately tell.
Disclosure: I am long $EURGBP as of this writing since last week.
Sterling Digest, 13 February 2014: phase two
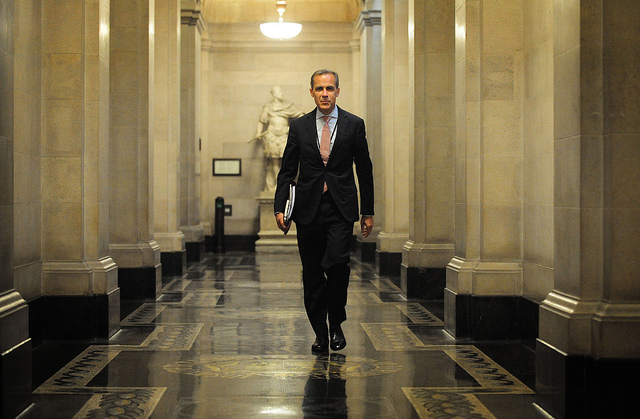
Bank of England Governor Mark Carney delivered the long awaited Inflation Report after “scrapping” forward guidance just a month ago. What Carney gave is what some are dubbing stronger guidance. He recognized and upgraded the UK economic recover and then added more indicators to produce “Forward Guidance – Phase 2”. Whatever you want to call it, the markets liked it and sterling rallied hard across the board. The rally continued even during the Asian session as those traders got the opportunity to digest the Inflation Report and Carney’s remarks. Now with sterling at key resistance levels, does it have the strength to go higher? What’s even more interesting to watch is if sterling can continue to rally in the face of a dovish BoE.
- It’s the hot money, stupid (FT Alphaville)
- Carney broadens forward guidance with extra slack (City Index)
- How Far Off Have the BOE’s Predictions Been? (WSJ)
- The U.K. Economy: Five Key Takeaways (WSJ)
- 3 Reasons Why the Bulls Loved The BOE Inflation Report (Baby Pips)
- BoE risk of a hike bought forward, GBP bid (FXStreet)
- Mark Carney putting a Canadian twist on the Bank of England (Forex Live)
- ‘RIP, Forward Guidance’: Revising Our Sterling Forecasts (eFXnews)
- A Look at British Pounds From the Top Down (All Star Charts)