
A bull-trap is a false signal that shows a decreasing trend in a stock, currency, index, or other financial instrument has reversed and is now heading upwards, when in fact, the value of the security will continue to fall. Traders or investors that acted on the buy signal generates losses on resulting long positions.
A bear-trap on the other hand is a technical pattern that occurs when the performance of a stock, index or other financial instruments incorrectly signals a reversal of a rising price trend. The trap is thus a false reversal of a declining price trend.
Many traders especially lose money after being caught up in traps. Many investors have lost huge funds in traps. Traps sometimes might take months or years if a reversal occurs at all. Traps affect the mental health of traders and investors.
Avoiding Traps In Trading
- Practise risk management
- Never ignore the long-time patterns before making entries.
- Don’t try to be too early, no one awards you for being the first trader.
- Never get into a trade when market squeezes.
- Don’t trade the initial breakout, watch out for the next few candlesticks to confirm.
- Trade in the direction of the main trend
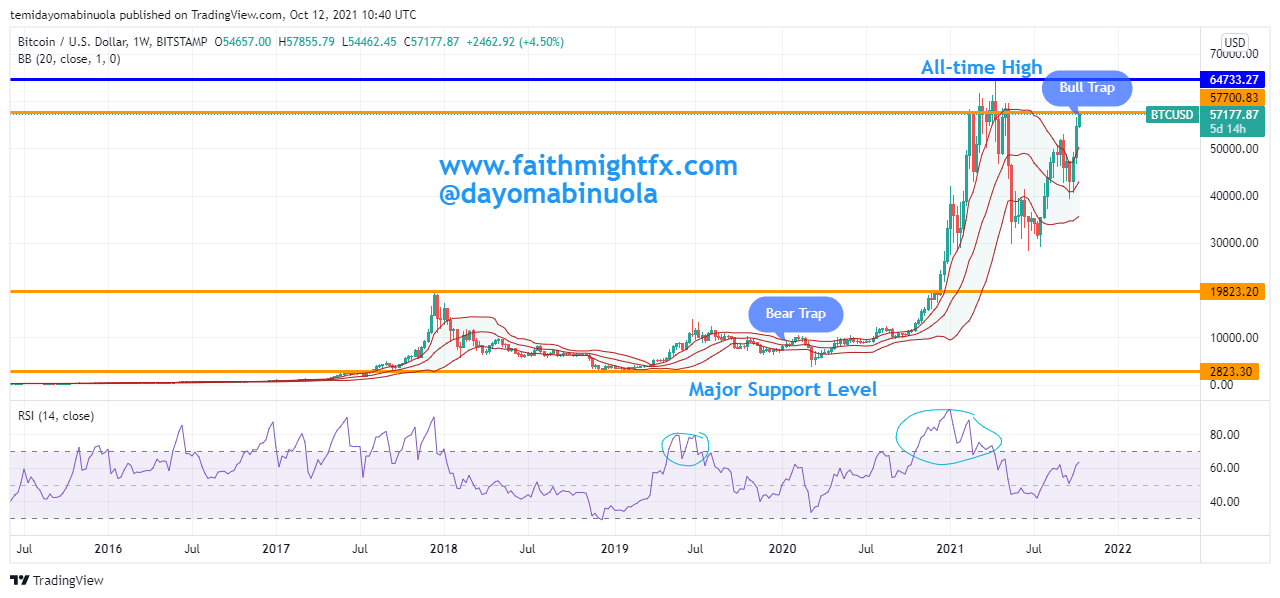
Taking a look at the BTC chart. In December 2020, the bulls broke out the initial resistance level in 2017 at $19,700. Ever since this breakout occurred, the price is yet to reverse. The closest reversal occurred in June 2021 when the price reached $28,300. I want to believe most BTC bears who shorted BTC in December 2020 must have been liquidated.
Also, the bulls reached a new all-time high in April 2021 at $64,700. Price reversed to $28,300 in June 2021. The bulls are back into more action as the price is currently at $57,200. Between February and May 2021, each time price opens above $57,000, it never closes above the $57,000. Traders and investors who invested above $57,000 must have been trapped. If the price reaches an all-time high, it ceases to be a bull trap.

