fbpx

Tides To Turn In Favor Of The New Zealand Dollar

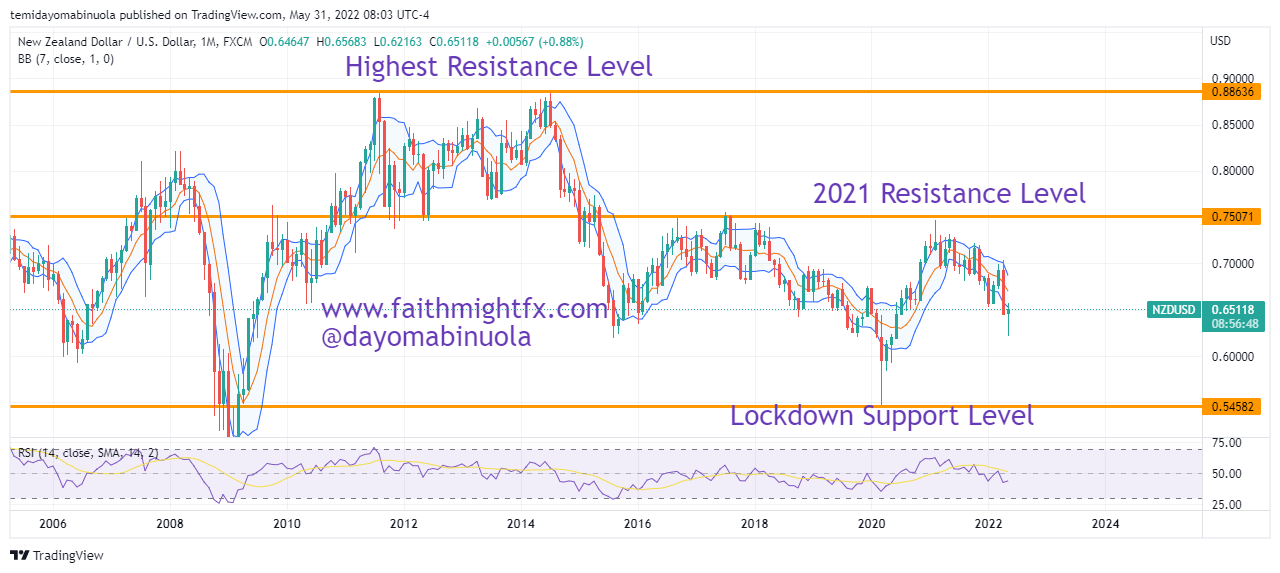
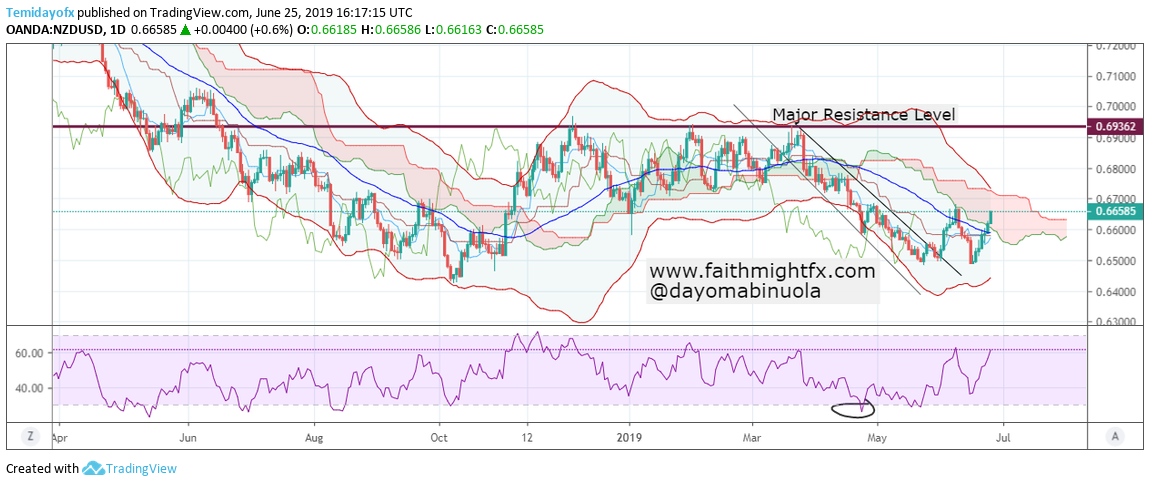
On May 31 2022, we published an article that the NZDUSD bears will stay dominant. This turned out to be the case and furthermore, the forecast we made was hit a few days ago. Across the board, the USD has gained against all major currencies. 

4hr Chart

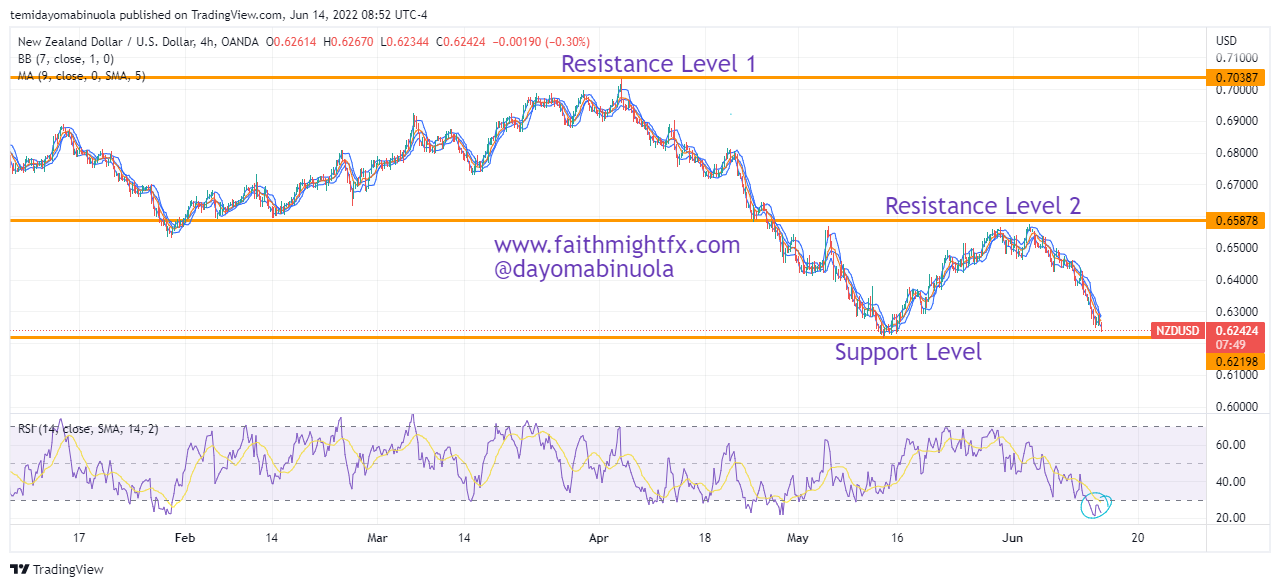
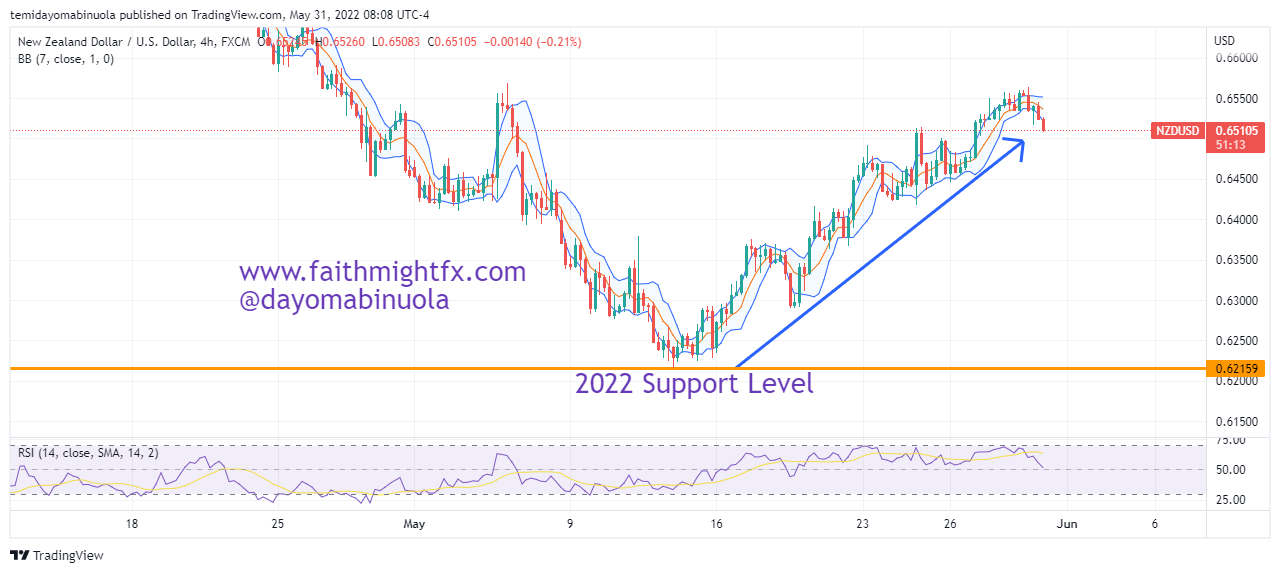
The support level of the year for NZDUSD is around 0.62205 and price fell this month to 0.62370 which is only a few pips above the support level. On the 4-Hour time frame, price is currently oversold. Also on the 4-Hour time frame, there are 5 dojis already formed which could be an indication of a possible reversal. 

Daily Chart

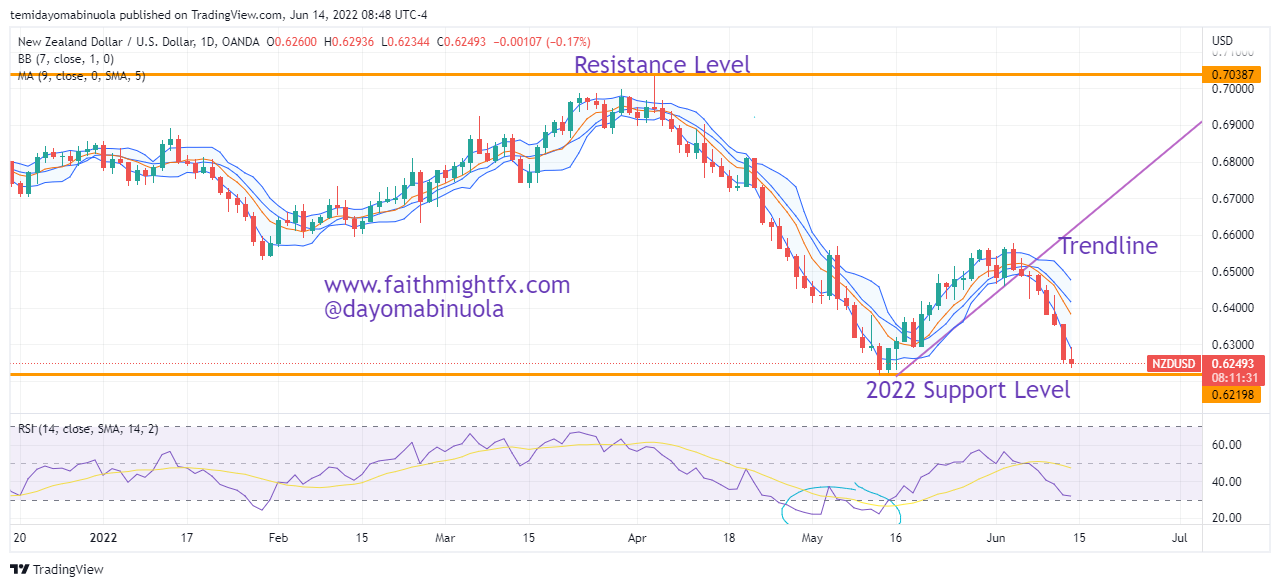
For the past two weeks, all candlesticks on the daily chart have closed bearish. We hope that in the next few days, as consolidation comes up, price could rally and a trend could begin in favor of the NZD. We look forward to NZDUSD appreciating to 0.64613 from its current price of 0.62493.

Some of these ideas are in our clients’ portfolios. To understand if this one can work for you or for help to invest your own wealth, talk to our advisors at FM Capital Group. Would you like more information on how to get currencies in your portfolio? Schedule a meeting with us here

Bears To Stay Dominant In NZDUSD Tussle

Looking at the monthly time frame over the last two decades, NZD has continuously gained against the USD. The highest price within this time span was at 0.88396 which occurred in September 2011. After this time, NZDUSD consolidated for another 3 years after which it began to dip leading to the US Dollar gaining against the New Zealand Dollar.

Monthly Chart

The first major drop in price brought NZDUSD to 0.61967 in July 2015. There was a bounce in Q4 2015 that initiated a bullish run that lasted till Q3 2017. This upward trend took the price to 0.75525 in July 2017 which was the highest price for that year. After this high, the New Zealand Dollar began to lose against the US Dollar. On the downward trend, price went as low as 0.54704 which occurred during the lockdown, in March 2020 precisely.

There was a jump in price in April 2020 and a bullish run ensued for the next 12 months, shooting price to 0.74678 in April 2021 – a gain of about 2000 pips. This price will be the highest in the year 2021. The bears kicked in again, forming an inverse head and shoulder on the monthly time frame.

4hr Chart

Since May 2022, NZD has been rallying against the USD and as a result, the price reached 0.65610 which stands as May’s resistance level. The USD in the coming days or weeks might gain against NZD as price might fall below 0.64271 which is about a 100 pips gain in favor of the US Dollar.

Some of these ideas are in our clients’ portfolios. To understand if this one can work for you or for help to invest your own wealth, talk to our advisors at FM Capital Group. Would you like more information on how to get currencies in your portfolio? Schedule a meeting with us here

NZDUSD Finds New Support Level

As a result of the global pandemic in 2020, the NZDUSD went as low as 0.54724. Since then, the New Zealand Dollar has been able to appreciate against the United States Dollar in the past two years. Between these two years, the price hit a high of 0.74670, and this happened in February 2021. Last year, the bears were more active on NZDUSD and the bearish trend from last year found a new Support Line at 0.65340 which is about 1000 pips from the high in Feb 2021.

1hr Chart

Despite the bearish turn in January 2022, the months of February & March 2022 have both been bullish. The NZDUSD pair is currently at 0.69511. This rally might not be maintained as RSI has shown multiple times that price has been overbought on the 1-Hour timeframe. Also, the price is currently consolidating on the 4-Hour timeframe. This consolidation might lead to a bearish turn that could drive the price down to 0.67374.

Monthly Chart

Some of these ideas are in our clients’ portfolios. To understand if this one can work for you or for help to invest your own wealth, talk to our advisors at FM Capital Group. Would you like more information on how to get currencies in your portfolio? Schedule a meeting with us here.

ON THE AIR with FUTURES with Ben Lichtenstein

Last week, I was back on the air with Futures with Ben Lichtenstein. Since we are still in the new year season, it was a great segment that they produced as a trip around the world in currencies. Starting with the U.S. dollar, Ben and I talked about the fundamentals that are really driving currency flows in the market right now.

This morning, traders were greeted by news that the EU and UK trade talks are deteriorating. I actually mentioned this fundamental risk last week in my segment with Ben. Check out more of my thoughts on all the major currencies below. My accuracy coming to fruition this week is even amazing to me 🙂

Enjoy the show!

Lydia Idem on TDA NETWORK
Click to watch!

If you are interested in a primer on how to read charts, please check out the new course, CHARTS101.

Does Kiwi Want to Bottom?

The New Zealand dollar has been in perpetual downtrend for much of 2019. It didn’t start the new decade any differently as the kiwi has slid almost 300 pips agains the U.S. dollar and a whopping 1,000 pips against the Great British pound.

On the bigger timeframes, it is clear that the $GBPNZD is finding resistance at the big 123% Fibonacci extension level. The 2.05 resistance level is also not too far from that level giving some strong resistance confluence for bulls. This area continues to provide a headwind for bulls, even in this new week of trading.

A key driver of NZD weakness last year was the slashing of interest rates by the Reserve Bank of New Zealand (RBNZ). The RBNZ cut interest rates by 100 basis points last year with two 50 basis point cuts. That’s a lot. And those 2 interest rate cuts came within 3 months of each other. So the RBNZ really surprised markets last week. Though they kept interest rates on hold at 1%, they were more hawkish than expected in their monetary policy statement. Despite the coronavirus outbreak worrying central banks around the world right now, the RBNZ is more optimistic about employment and the economy than it had been in 2019 as inflation moves closer to the RBNZ’s target. The biggest influence to this change in outlook, however, has been new fiscal policy from the New Zealand government around infrastructure spending. The central bank expects this to boost consumer spending and GDP which is only good news for the NZD.

Despite the rosier fundamentals, the market has not taken much notice. Yet. The $GBPNZD remains rangebound between the 123% Fibonacci level at 2.0409 and the major 2.00 support level. The shift in fundamentals favors more downside moves in the $GBPNZD as the NZD should start to move higher. Look for rallies to continue to be met with sellers at the resistance level. Only a hold above the 2.05 level changes the downside bias in $GBPNZD.

If you are interested in learning how to read charts these charts for yourself, please check out the new course, CHARTS101.

Read more:

Extreme Positions

Check out the positioning in the forex market as we were headed into today’s FOMC meeting. Though Walle Smith points out here the crowding into GBP shorts, look at the USD positioning last week as reported by the CFTC. In light of today’s 25bps rate cut, 2 dissenting FOMC members who wanted to hold on interest rates, and verbal confirmation during the press conference from Federal Reserve Governor Powell that there will be no cycle of interest rate cuts, the positioning in the market is not at all stretched. With all of that just happening, there was still room in the long USD trade. Which is very interesting when you look at the trends against the other major world currencies. The market has significant room before it even is considered crowded with long USD positions.

My take is that the Fed has pretty much given markets the green light with no real reason to sell the USD. And it is likely that the USD continues to move higher still.

NZDUSD Gradually Going Bullish

There has been low volatility with the $NZDUSD pair from December 2018 to the end of March 2019. Towards the end of March, the dip in price made $NZDUSD reach 0.64896 from the major resistance of 0.69362. The trendlines have been broken to the upside indicating a change of trend. In the first week of June, price was able to reach the middle line of the Bollinger bands. It tried to break it before a correction occurred.

NZDUSD Daily Chart


As it stands, in the last two trading days, price was able to break the middle line to the upside. The bulls might have been able to gather momentum for a complete bullish movement. RSI before the breakout from the trendlines has shown oversold positions. The NZD is presently gaining strength against the USD. Price of $NZDUSD might go back to the resistance level of 0.69362 in the next few weeks. Ichimoku still shows the bears are in charge. Though $NZDUSD price is presently in the cloud with the bulls in charge, a breakout from the cloud upwards might conveniently push price to 0.69362.

The Quiet Kiwi

The NZD trades in the shadow of the almighty AUD and the more familiar CAD thanks to its proximity to the US. While the NZD is a commodity play, it is not a play on energy like the AUD and CAD, but on foods like dairy and cattle. Even as inflation has edged lower in many countries, food prices remain stubbornly high. The high prices in these and other agricultural commodities have gripped the NZD in a bull rally for much of 2012.

The $GBPNZD enjoyed an incredible rally in the 1st half of the year. So it seemed natural that a pullback occurred off the key resistance level of 2.10. But when the $GBPNZD broke below the major psychological level at 2.00, price broke down to new lows at 1.47. Since that low, price has marched higher. Last week, price staged a breakout above the previous high at 1.9825.

GBPNZD DAILY

The new week open has seen price gap higher to a high of 1.9880. The pair is firmly bullish to open the new week. The key level this week is 1.9750. If $GBPNZD remains supported above 1.9750, price targets a move above 2.00. A close below 1.9750 sees price move lower below 1.95. Because the fundamentals still look strong, it will be interesting how price behaves at the 2.00 level which is also the 50% Fibonacci level of the entire breakdown. Trade what you see.

GBPNZD DAILY WITH BIG FIB


Disclosure: No position