fbpx

Against All Odds, SPX Hits A New High

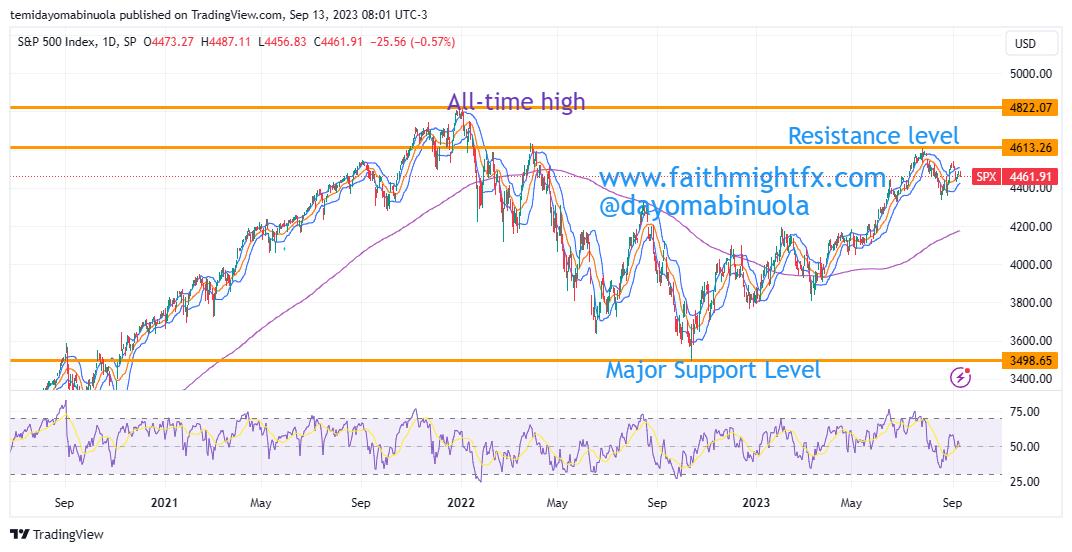
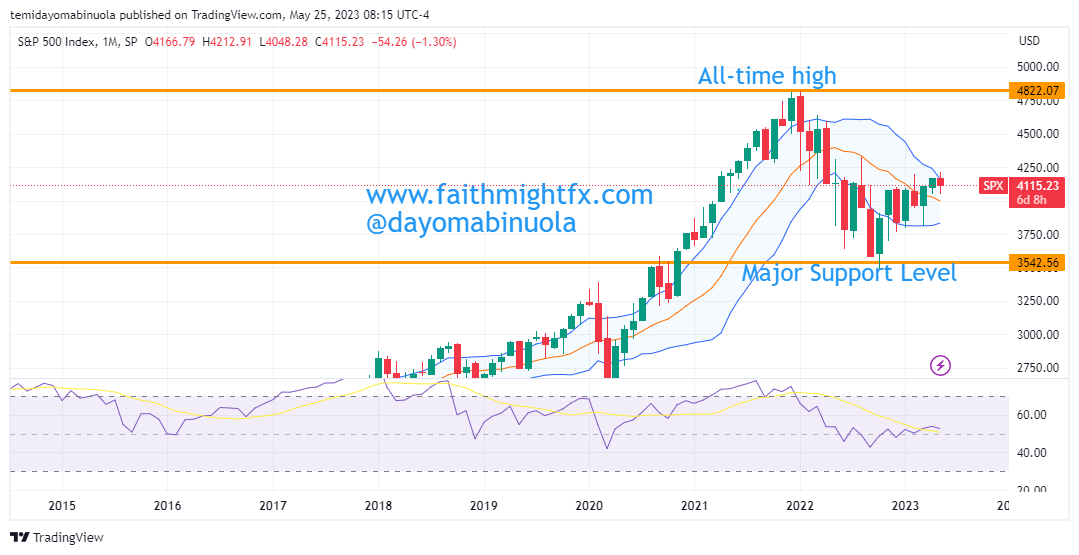
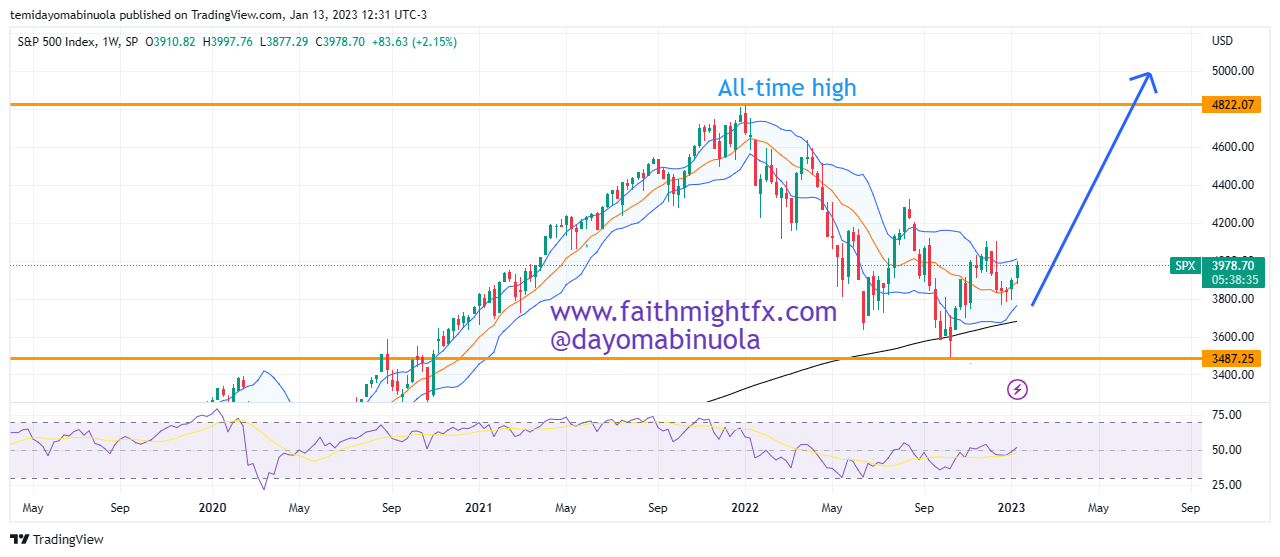
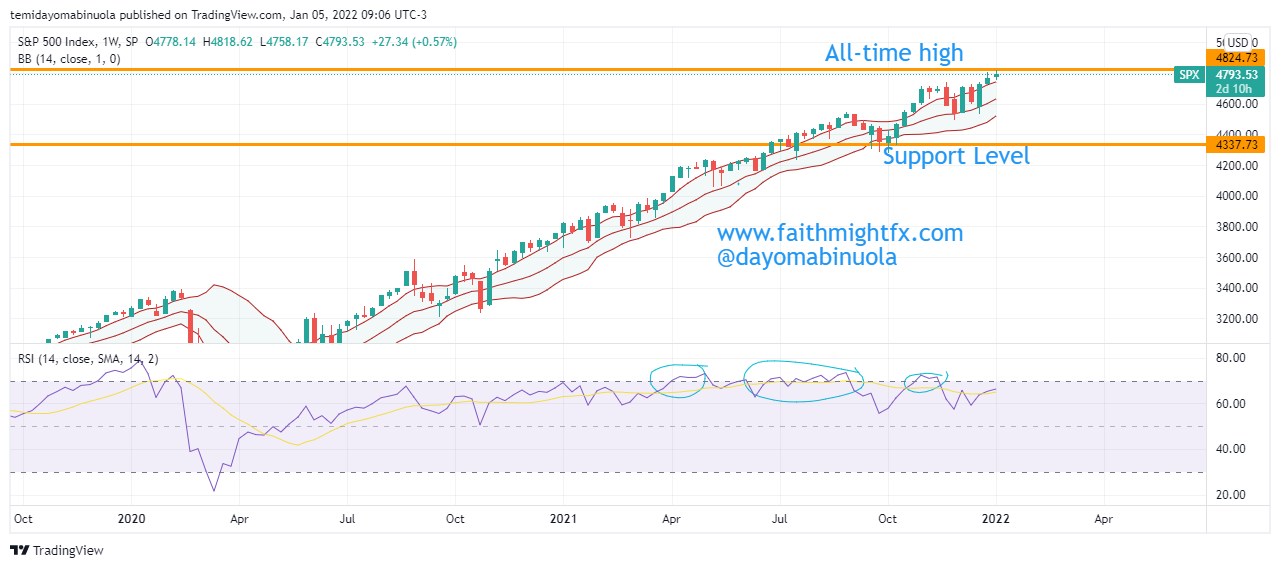
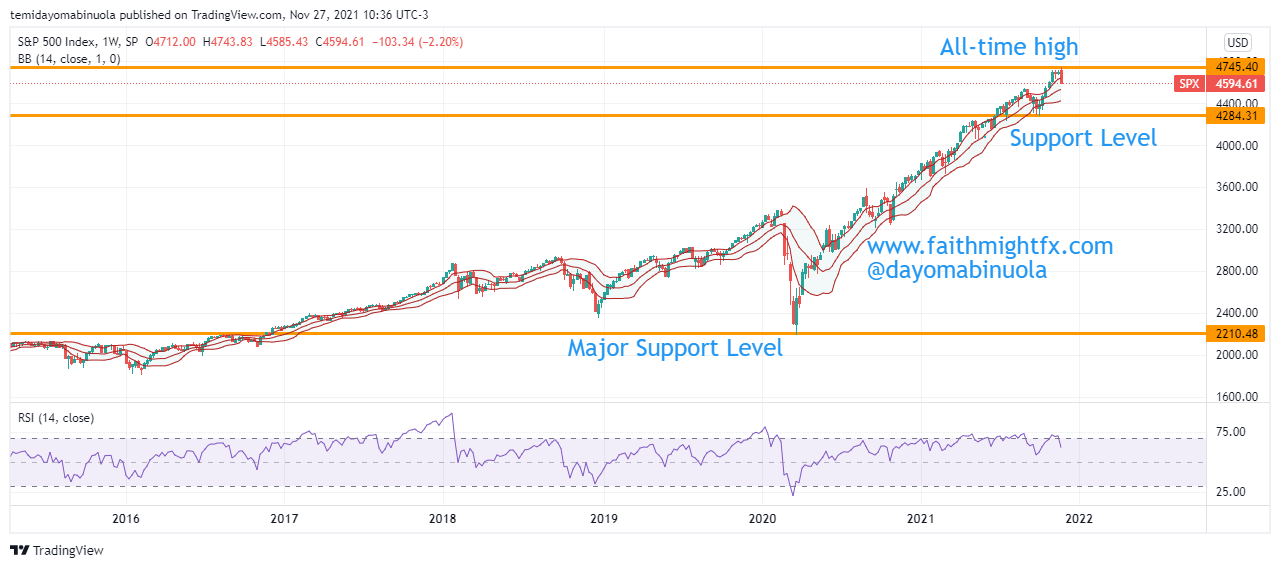
S&P 500 was founded 66 years ago. It is traded in 3 exchanges including NYSE and NASDAQ. The S&P 500 is used to track the best 500 traded companies in the United States. The market capitalization of S&P 500 as of December 29, 2023, was $42 trillion. SPX made a historical move from the lockdown low of $2196.55 to the previous high at $4864.61. That was an over 120% increase in a 2-year bullish run.

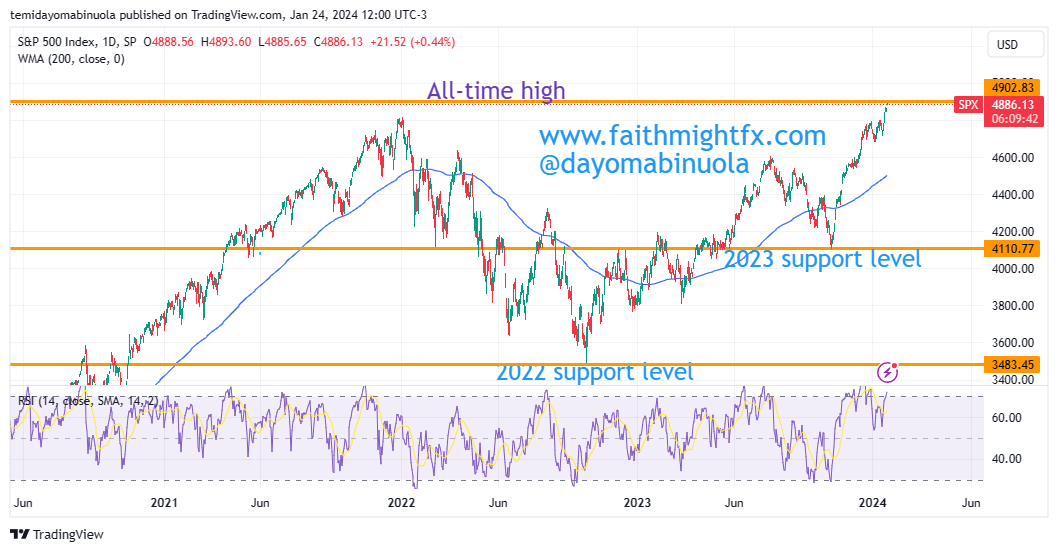
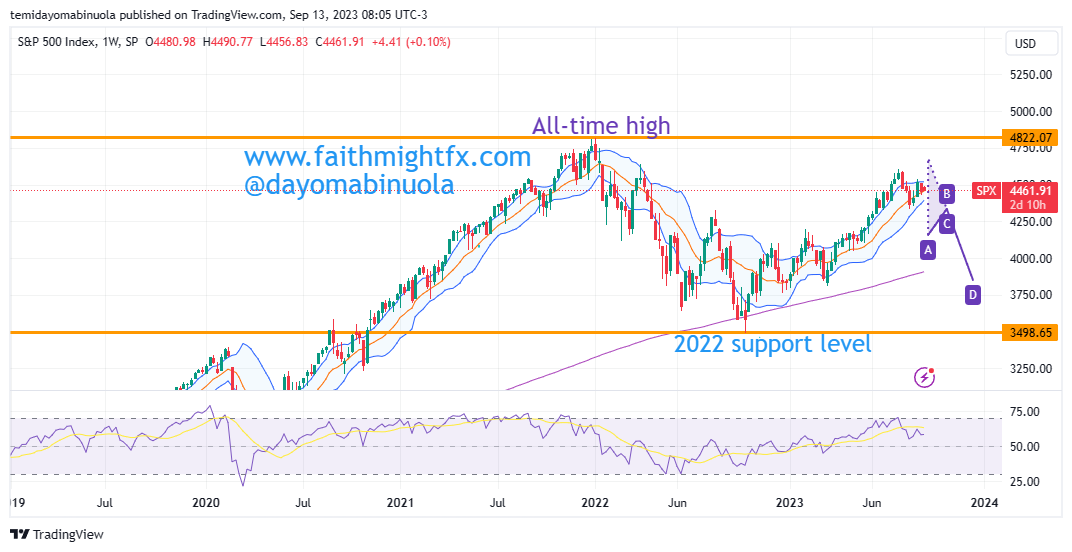
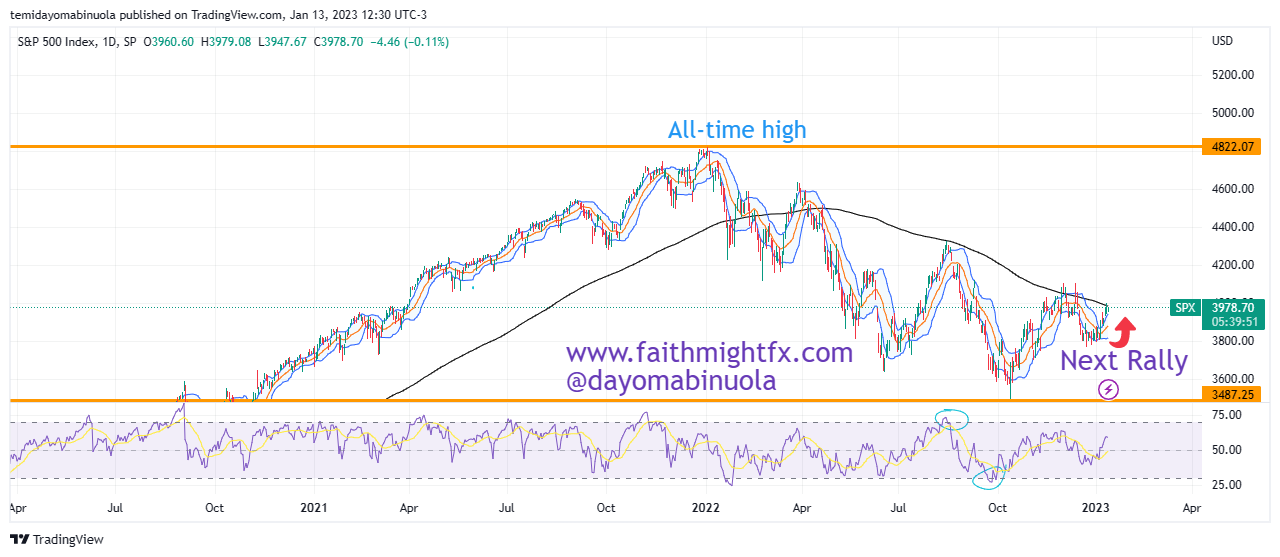
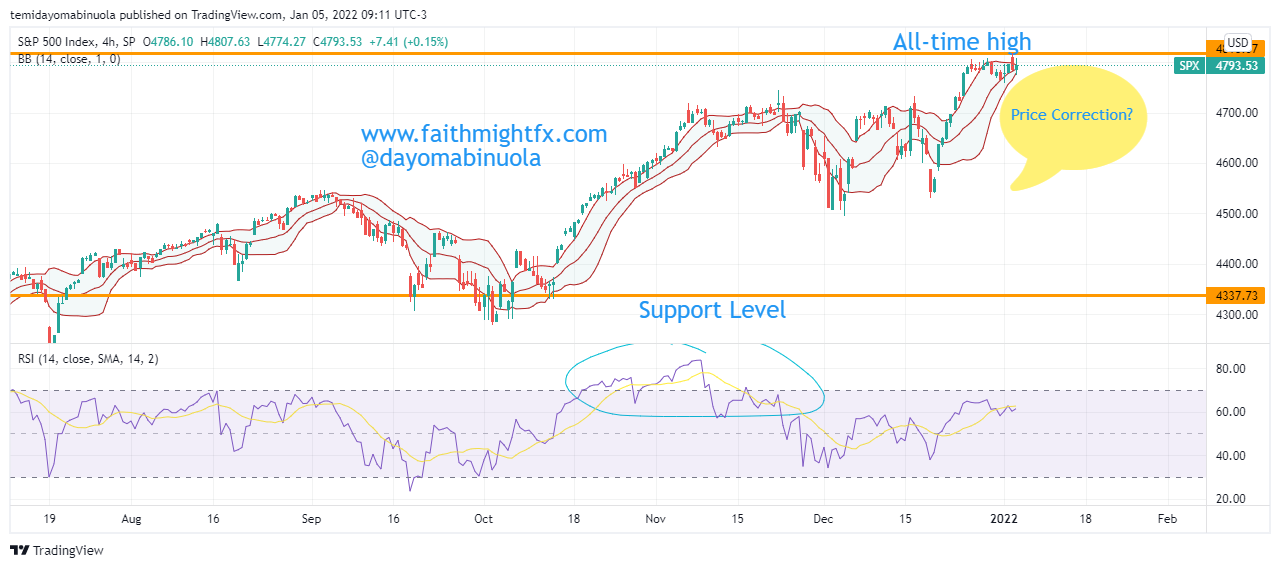
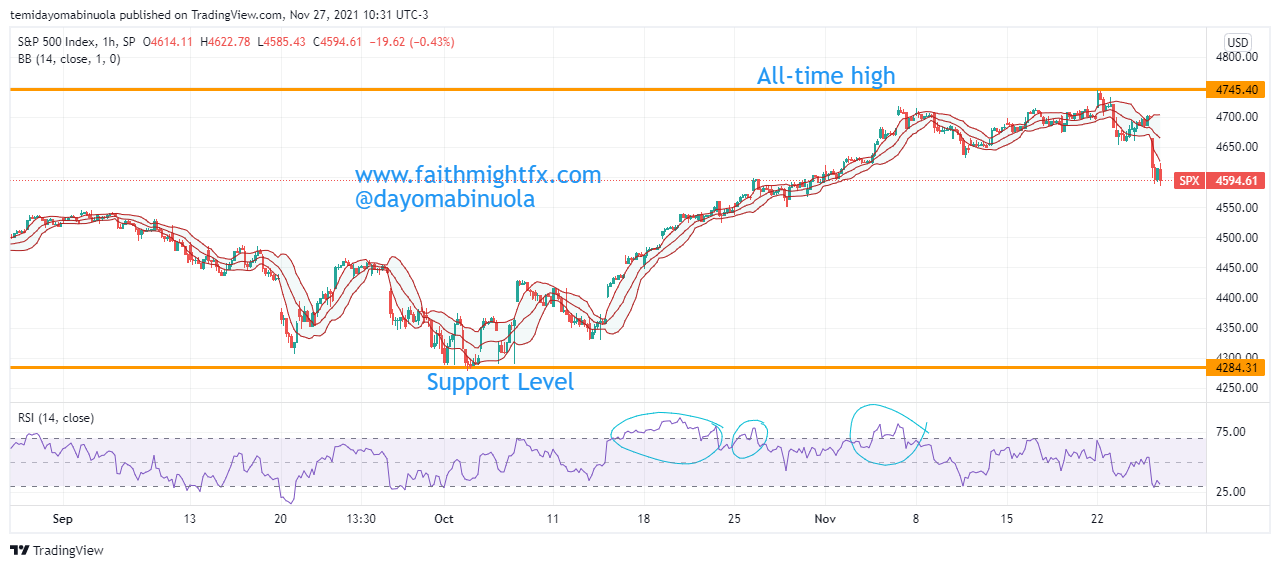
This month makes it two years the S&P 500 price hit a new high. A breakout to the upside occurred on the 19th of January which has made SPX’s price hit a new high at $4865, the rally has continued as SPX continues to hit new highs as price is currently at $4,891.

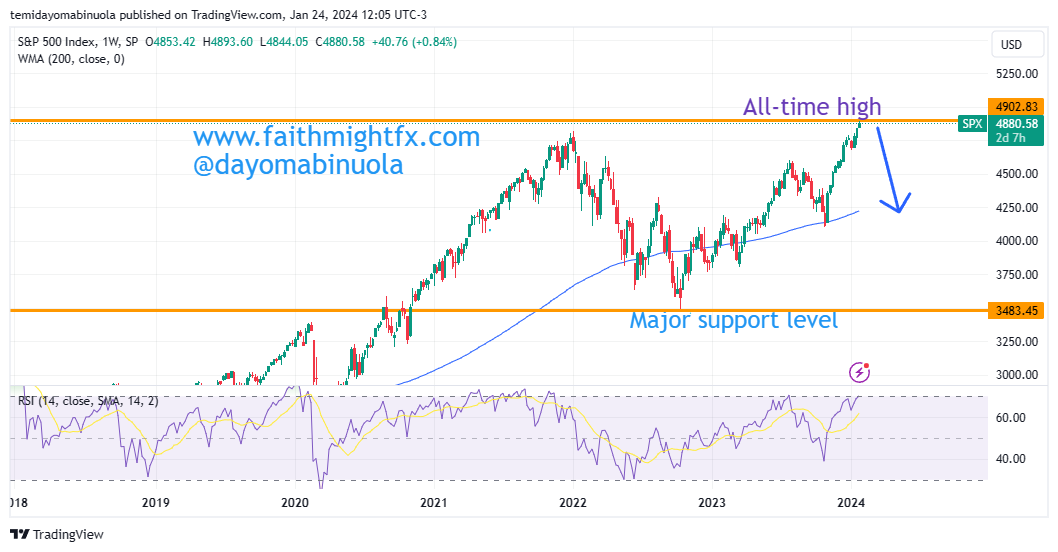
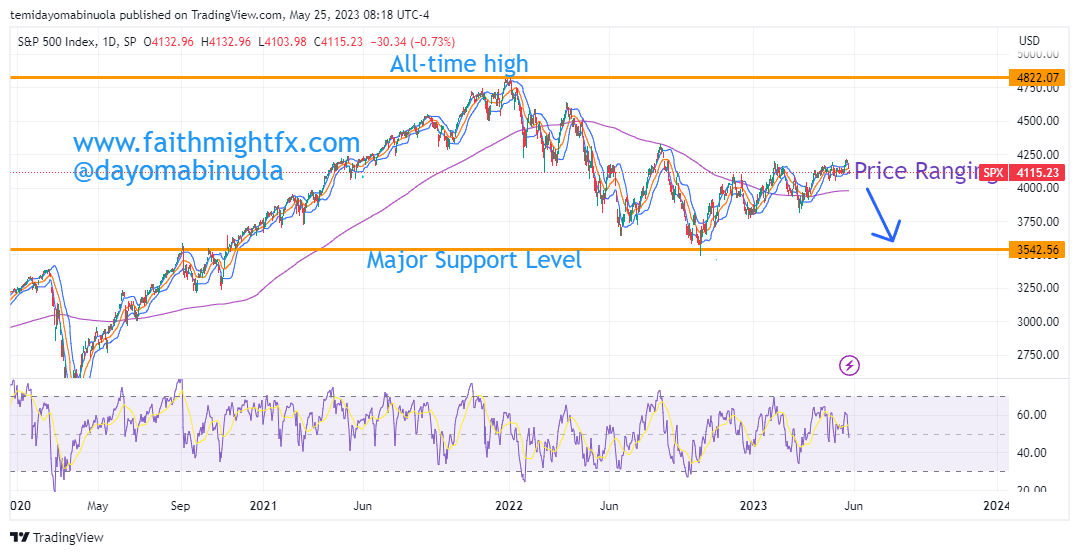
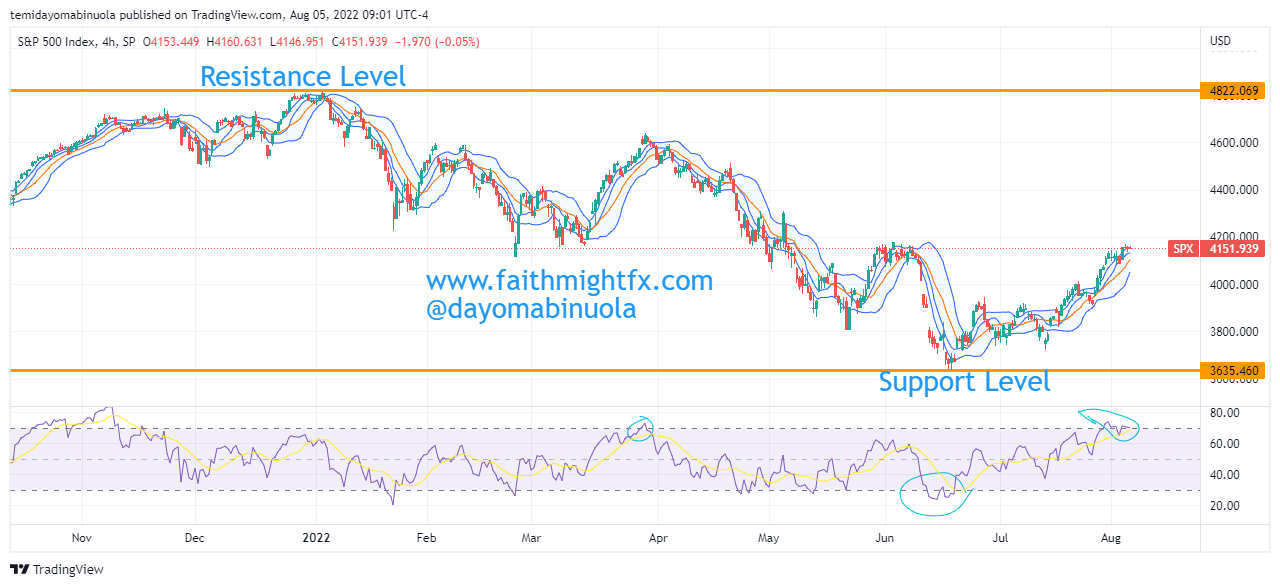
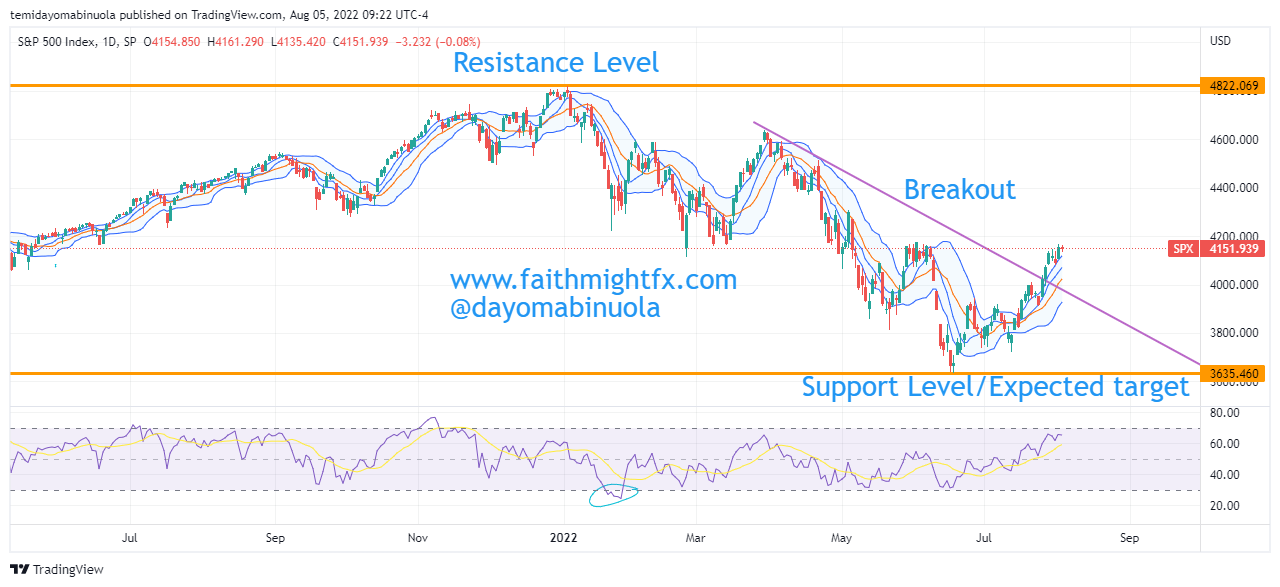
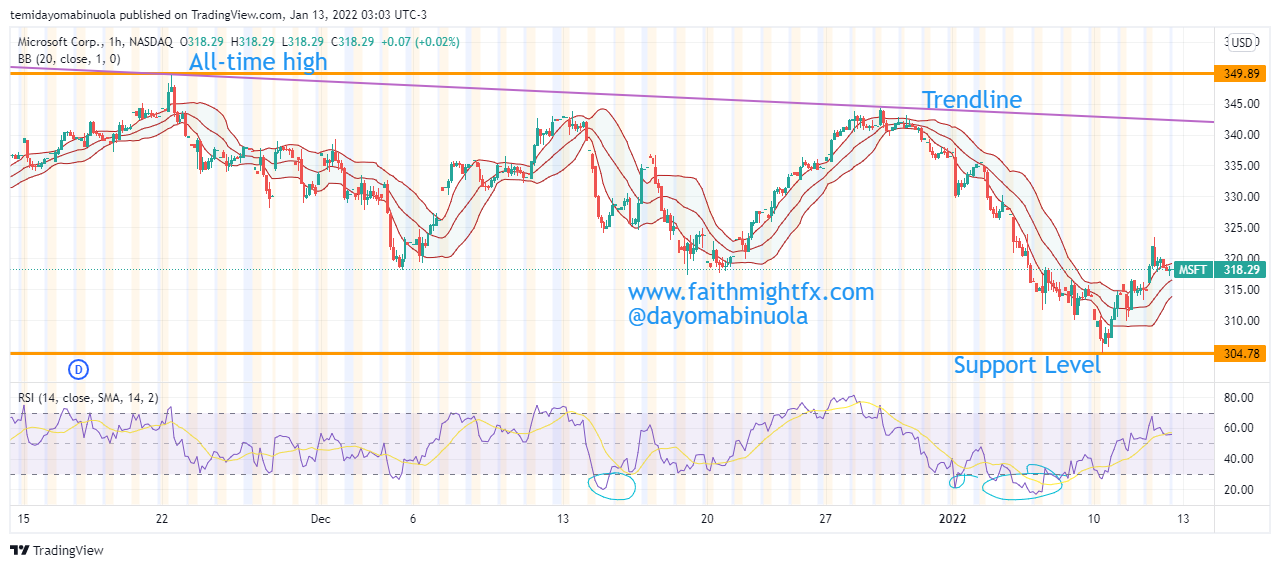
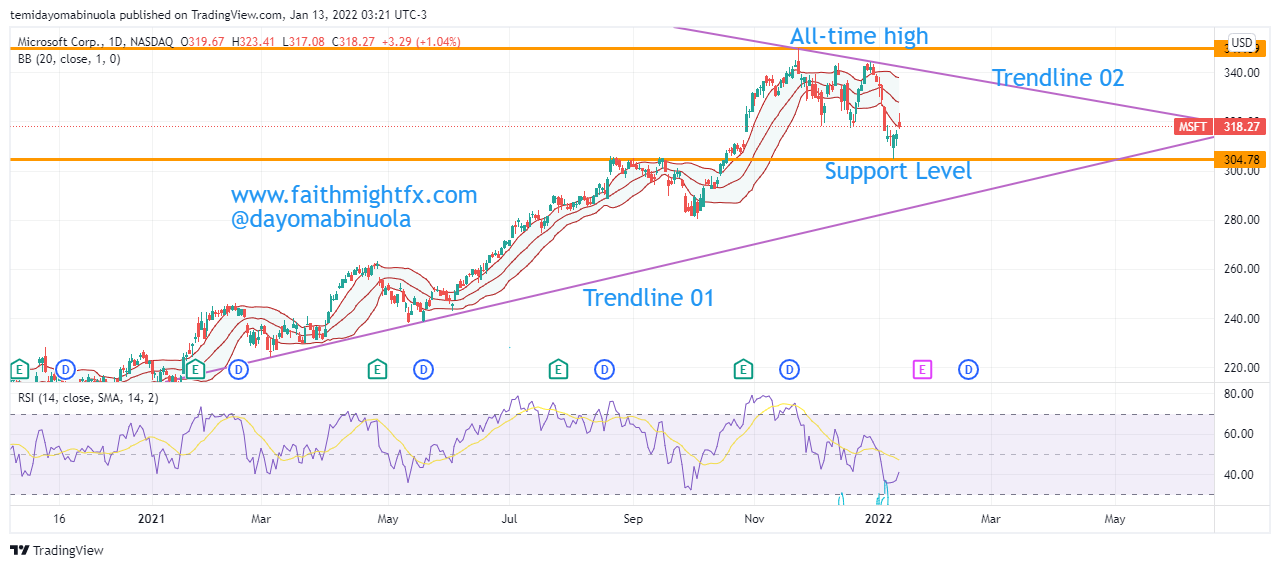
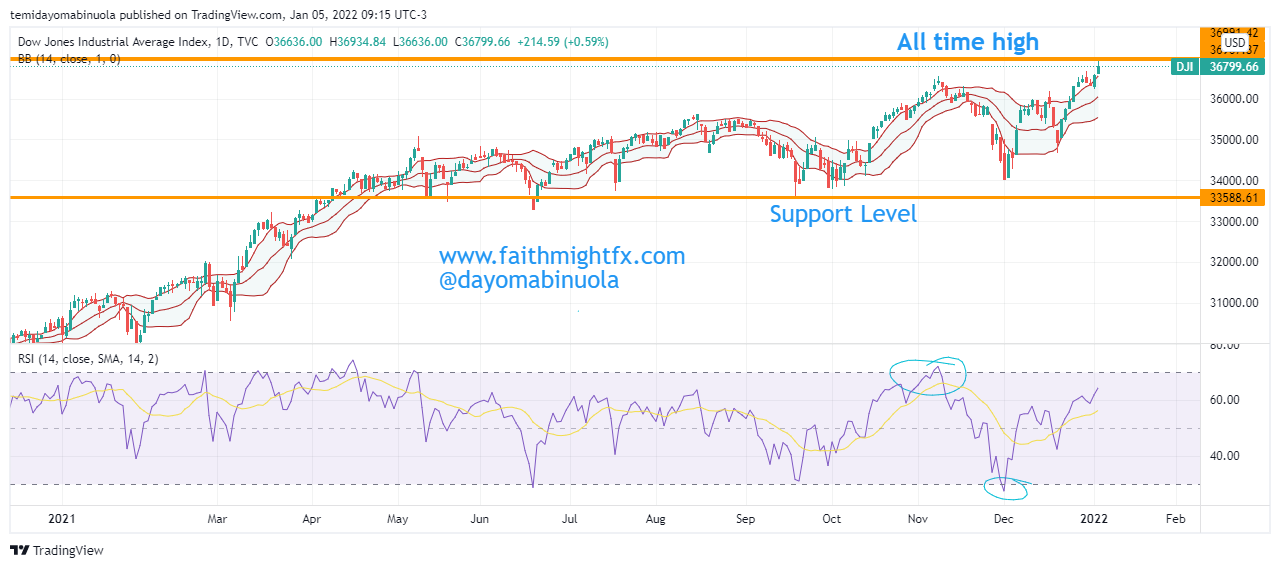
The bullish momentum for SPX might be cut short soon as the bears might push price lower to $4133. On the daily chart, RSI has shown the price has been overbought multiple times since November 2023. As a result of the new high in January 2023, the RSI has hit the overbought position.

Some of these ideas are in our clients’ portfolios. To understand if this one can work for you or for help to invest your own wealth, talk to our advisors at FM Capital Group. Would you like more information on how to get stock indicies in your portfolio? Schedule a meeting with us here

SPX To Rally Above $4,500 Again

The stock index has gained over 600 points in 2023 despite a huge fall in 2022. After the price of SPX reached an all-time high of $4822 on the second trading day of 2022, the bears took charge as price reached $3493 – the lowest price of SPX since November 2020. SPX in the next one year has the potential of rallying past $4700. However for now, we might see a short-term rally, after which we might see price falling below $4000 in the coming months.

On the 27th of July 2023, the price of SPX reached a 2023 high at $4613. There was a correction after this milestone was reached. The correction made price fall to $4341 on the 18th of August. Price of SPX at $4341 currently stands at a temporary support level. The bulls have been able to push price higher. The current price of the S&P 500 stands at $4461. We might see a rally in the coming days above the psychological level of $4500.

Some of these ideas are in our clients’ portfolios. To understand if this one can work for you or for help to invest your own wealth, talk to our advisors at FM Capital Group. Would you like more information on how to get stock indicies in your portfolio? Schedule a meeting with us here

SPX Likely To Dip To Previous Support Level

The Standard and Poor’s 500 commonly known as SPX or S&P 500 is a stock market index that was founded 66 years ago. It is one of the most commonly followed equity indices. As of December 31, 2020, more than $5.4 trillion was invested in assets tied to the performance of the index. As of December 31, 2022, the market cap of SPX was at $33trillion. Since SPX was launched on the stock exchange in 1972 at $4.49, the index has been on a long-term bullish run. Each time a correction occurs on the monthly chart, the price of SPX reaches a new high. The all-time high of SPX is $4,822 which was hit in January 2023.

The opening price of SPX in 2022 was $4,777 and closed at $3,825. The stock index had a woeful 2022. 2023 has been bullish with SPX opening for the year at $3,856. 2023’s high was hit this month at $4,215. The support level of SPX in 2022 was $3,497. In the coming weeks, we might see the price of SPX fall to $3,497 from the current price ranging a little bit above $4,000. As of the time the article was written, the price is at $4,115.23.

Some of these ideas are in our clients’ portfolios. To understand if this one can work for you or for help to invest your own wealth, talk to our advisors at FM Capital Group. Would you like more information on how to get stock indices in your portfolio? Schedule a meeting with us here

S&P 500 Bounces From 2022 Support Level

S7P 500 bounces from Support Level

For about two years, between March 2020 and January 2022, SPX was in a bullish marathon. The support level as of March 2020 was $2210. The rally peaked at $4822 in January 2022. This price stands as the all-time high for the stock index.

Despite price reaching the all-time high in 2022, last year was a bad year for SPX investors as price went as low as $3488 in October 2022 as a result of the bearish turn. That low was 2022’s support level. 2023 has shown a bit of hope as there has been a bounce from 2022’s close of $3833. SPX opened in 2023 at $3845 and is currently at $3969.

Daily Chart

On the daily chart, RSI indicates that price was oversold as of October 2022. This might be the reason for the recent rally. This oversold position may be able to create a bullish force that in the long run can push SPX above the all-time high thereby creating a new all-time high. However, in the short term, we might be seeing price rally above $4200 in the coming weeks.

Weekly Chart

Some of these ideas are in our clients’ portfolios. To understand if this one can work for you or for help to invest your own wealth, talk to our advisors at FM Capital Group. Would you like more information on how to get stock index in your portfolio? Schedule a meeting with us here

SPX Continues To Rebound

In the second trading day of January 2022, SPX hit $4800 which is the all-time high. Afterwards, SPX experienced lower lows and lower highs which resulted in a fall in price to the 2022 low of $3635 in mid-June 2022. While SPX fell between January and June, it established a couple of resistance levels with the last resistance level before the year’s low being at $4179 which was in the beginning of June.

4hr Chart

Since the 2022 current low of SPX which was reached in June at $3635, the price of SPX has continued to rally. This rally has taken the price above the $4000 psychological level. In the last 5 trading days, the price of SPX has been able to close above $4000 as the current price is at $4152. A breakout from the June resistance level may occur and price could reach $4200 but this is not guaranteed. 

Daily Chart

The reason why the upside movement of SPX can’t be guaranteed is because the momentum on the bulls is waning. On the flip side, whether price reaches $4200 or not, the bears might eventually take over and push price below the current low and a new low might be formed below $3635 as RSI is currently showing that price is overbought on the 4H timeframe.

Some of these ideas are in our clients’ portfolios. To understand if this one can work for you or for help to invest your own wealth, talk to our advisors at FM Capital Group. Would you like more information on how to get stocks indices in your portfolio? Schedule a meeting with us here

Etsy Share Price Consolidates

American e-commerce company, Etsy, began to suffer a big loss in share price after an all-time high was reached at $307.57 on December 26, 2021. $ETSY has lost about $200 since its all-time high last year December.  The bears have been more active since the beginning of the year 2022. Etsy opened the year 2022 at $222 but has since lost about $100, leaving it at $124.28 as at April 1, 2022. 

Weekly Chart

In the past 5 months, there have been several indications of the price being oversold on the Etsy 4hr Chart . Etsy’s previous support level on the weekly chart was maintained at $155.15 since May 2021. The recent downward slide this year has made Etsy reach a new support level at $108.95 as of February 24, 2022. The next bull run for Etsy might make the price reach $278, which is over $105 gain from its current price. In a situation where the bulls continue to push prices higher than $278, a new all-time might be reached. As price consolidates, a breakout to the upside above $164, could be the clue for the next bull run.

4hr Chart

Some of these ideas are in our clients’ portfolios. To understand if this one can work for you or for help to invest your own wealth, talk to our advisors at FM Capital Group. Would you like more information on how to get stocks in your portfolio? Schedule a meeting with us here.

S&P500 Bounces After The January Dump

A huge selloff has occurred in the price of $SPX since the beginning of this year after the market opened on the first trading day of the year at $4784.65. On the second trading day which was on the 4th of January, the price reached a new all-time high at $4817.87. The bearish confirmation was on the year’s third trading day after $SPX lost over 80 points in a day.  The month of January was bearish for $SPX after its loss of over 260points, which was almost a 6% loss from the year’s opening price of $4776.61. Just like the American market, the European and the Chinese markets had a poor January as the market was majorly bearish. In January, $SPX had the worst month since March 2020. Our analysts forecasted the price drop of $SPX in one of our articles in January 2022.

4hr Chart

The sell-off in January was due to the Fed signaling its readiness to tighten monetary policy, including raising interest rates multiple times this year to tame inflation that has shot up to the highest level in almost 40years. The $SPX has been a bull market over the decades. The sell-off in January was a normal correction expected in a bull market. The correction of $SPX made the price hit the lowest price in January at $4221.07. A bounce from the dip occurred in the last week of January as a Doji was formed, which could lead to the beginning of price recovery. The bulls are beginning to gather momentum as the price closed at $4505.15, about 7% price appreciation from the January low. As the bulls begin to become more active, the price could reach $4805.68 in the coming weeks. Price has currently crossed to the upper region of the Bollinger bands on the 4hr chart. 

Weekly Chart

In the 12 months of 2021, $SPX had a new all-time high in each of them. $SPX has continued with a new all-time high in January before the dump. Will a new all-time be reached in February?

Some of these ideas are in our clients’ portfolios. To understand if this one can work for you or for help to invest your own wealth, talk to our advisors at FM Capital Group. Would you like more information on how to get venture capital in your portfolio? Schedule a meeting with us here.

Microsoft Bounces From The Year’s Support

After the all-time high of Microsoft was reached on the 22nd of November, 2021, the price has continued to drop from the highest close on the 28th of December 2021 at $343.00. From the trendline drawn from the all-time high in 2021, the price is yet to break it to the upside. Microsoft investors have little or nothing to worry about, as the price has appreciated in the last two decades. 

1hr Chart

Just recently, Microsoft hired a top Apple Engineer, Mike Filippo, to work on custom chips as it looks to expand its own server-chips efforts, according to people with knowledge of the matter. Filippo’s exit is a huge loss to Apple after he has served as a top designer of semiconductors at ARM for a decade. Microsoft’s 2022 opening price was $335.24. The $MSFT bulls have failed to show up since the holidays were over. Price keeps falling as low as $304.78 on the 10th of January, 2022, making it the year’s support level. A gap-up occurred yesterday from $315.06 to $319.57.  This might lead to price recovery as our analysts look forward to the price of Microsoft reaching $341.48.

Daily Chart

There is no indication of price reaching a new all-time high as we look forward to receiving the earning report of Microsoft on the 25th of January 2022. On the daily chart, RSI shows the price is overbought while on the 1hr chart price is currently oversold. The hire of Filippo might boost the share price of Microsoft in the coming weeks. The trendline 01 on the chart shows that price is on a bull trend despite the bad start in 2022. RSI though shows price is overbought on the chart.

Some of these ideas are in our clients’ portfolios. To understand which ones can work for you or for help to invest for your own wealth, talk to our advisors at FM Capital Group. Would you like more information on Investment Advisory, Portfolio Services, and VC? Schedule a meeting with us here.

S&P 500 And Dow Jones Reach A New All-Time High

 In our November article on S&P 500, the price had a correction as our analysts forecasted that $SPX could reach a new all-time high at $4800. The $4800 forecasted price was surpassed as the most recent all-time high is at $4824.53.  Many stocks in the SPX appreciated around this time. SPX has been able to make 1X since the pandemic lowest price at $2210. The current price of SPX is $4793.53 after the price closed yesterday lower than the all-time high at $4824.53. 

SPX Weekly Chart


The new variant of the coronavirus named ‘IHU’ detected in France might likely pose a threat to the index, which might lead to a price fall.  A sell-off might occur which could make the price of SPX fall to $4384.23. Despite the new all-time highs in the past months, SPX on the RSI has shown that price has been overbought multiple times since April 2021. 

SPX 4hr Chart


Dow Jones on the other hand made almost 1X the pandemic low at $18366. The Dow Jones recorded a new all-time high yesterday, being the second trading day of the year. There is no indication of a possible reversal. Early in December, our analysts forecasted the Dow Jones to reach a new all-time high. The new all-time was reached yesterday at $37,000.  A correction might take place.

Dow Jones Daily Chart

As SPX had a price fall on the second trading day of the year, Dow Jones extended its rally to a new all-time high at $37,000. The only threat to the continuous rally of the $DJI could be the new variant ”IHU’, which health officials found it has 46 mutations. These mutations are more than the omicron.  The price still maintains the upper region of the Bollinger bands. The $DJI might continue its rally for the next few days or weeks.

Dow Jones Weekly Chart

Some of these ideas are in our clients’ portfolios. To understand which ones can work for you or for help to invest for your own wealth, talk to our advisors at FM Capital Group. Would you like more information on Investment Advisory, Portfolio Services, and VC? Schedule a meeting with us here.

SPX Had A Price Correction

S&P 500’s opening price in 2021 was $3699.90. Price has been appreciating leading to different all-time highs. The SPX has done so well with return for investors as each month since the beginning of this year, there have been new all-time highs reached. The latest all-time high was reached at $4,745.40. This week has been very bad for $SPX has the price fell to $4,594.61 from the weekly opening price of $4711.61. Many stocks’ prices fell during the week as a result of the new variant of coronavirus discovered in South Africa named ‘Omicron’. A few countries are back to a lockdown to avoid the spread of the various. Countries are beginning to restrict movement to and from South Africa. As of July 2021, there are four dominant variants of the Coronavirus.

On the weekly chart, the $SPX closed this week with a bearish candlestick. Looking at the 2020 chart of $SPX, especially before the spike in the cases of Covid-19 globally, the then all-time high in February 2020 was at $3384.11, the price fell to $2210.48 in March 2020. Since the lockdown, the price has been appreciating as price doubled since the lockdown has been eased. The support level at the second half of this year is maintained at $4284.31. The weekly charts show the candlesticks are still in the upper region of the Bollinger bands despite RSI showing that the price has been overbought. The bulls are still very active despite the correction this week. The price of $SPX might appreciate in the next few weeks, which might lead to a new all-time high above $4,800.

Some of these ideas are in our clients’ portfolios. To understand which ones can work for you or for help to invest for your own wealth, talk to our advisors at FM Capital Group. Would you like more information on Investment Advisory, Portfolio Services, and VC? Schedule a meeting with us here.