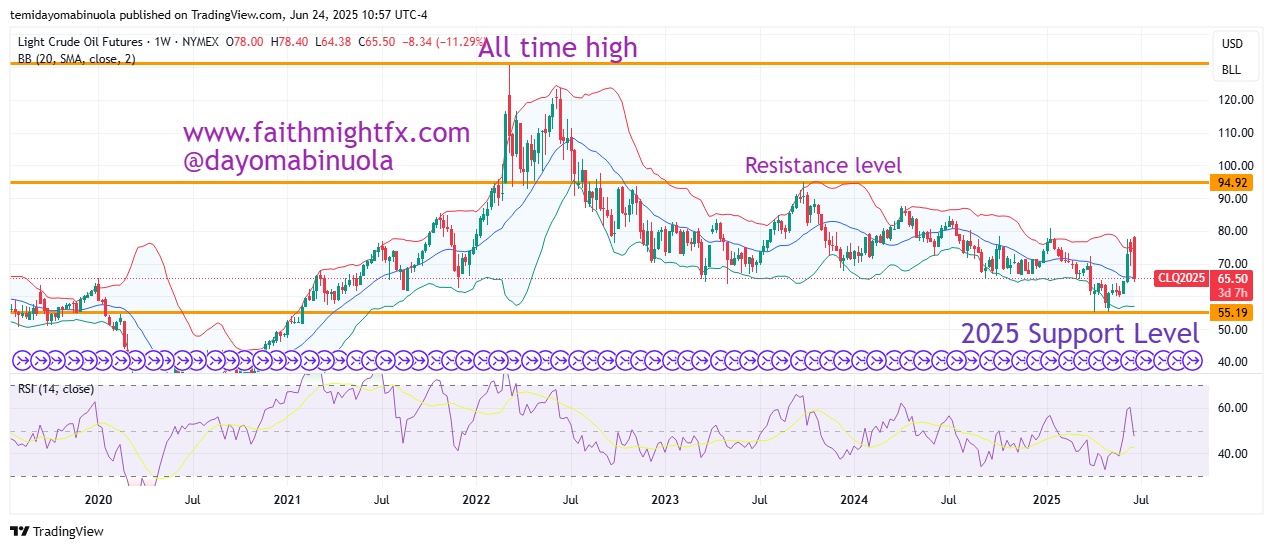
Last week, oil prices endured another volatile week, propelled by geopolitical unrest and shifting fundamentals. Brent crude settled at $77.01, up from $75.18, and WTI rose to $74.93 from $73.18. Early-week surges were fuelled by heightened Israel-Iran tensions and threats to the Strait of Hormuz, which handles about 20% of global oil flow. Prices dipped to $69–70 by Tuesday as ceasefire hopes grew, with missile strikes sparing energy infrastructure, but rebounded to the mid-$70s by week’s end. The market remains torn between high global inventories—bolstered by record May builds and steady U.S. output—and a persistent geopolitical risk premium. Some analysts warn that a Strait disruption could propel Brent beyond $100, potentially hitting $120, severely tightening supply.
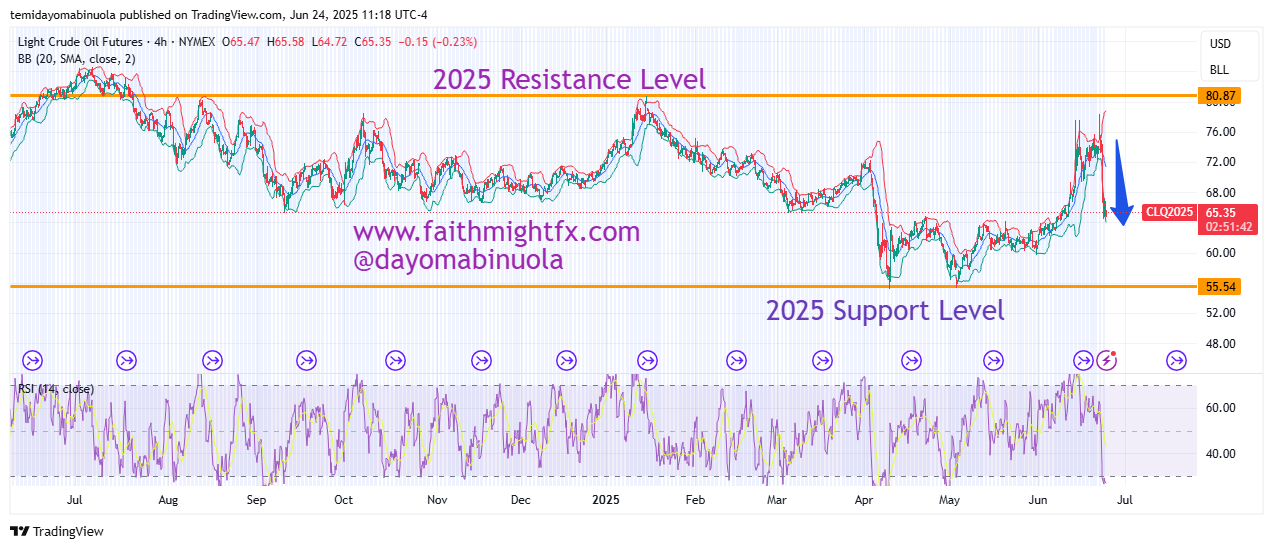
The WTI facing resistance at $77 and support between $57–44. Speculative trading amplifies volatility, as hedge funds bet on price swings amid shaky Middle East de-escalation prospects. A sustained ceasefire, with Iran avoiding oil routes, could stabilize prices in the $70–77 range, but escalations could spark sharp spikes. OPEC+ may adjust production cuts in December, while China’s sluggish economy caps demand growth, though winter demand may offer support. U.S. policy shifts, Russian supply uncertainties, and long-term renewable energy trends add complexity, leaving traders braced for volatility as geopolitical “what-ifs” dominate pricing.
Oil is $67 as of the time of publishing this article. We are projecting the price of oil to dip to $59 in the coming days as all gains of last week could be lost as Israel and Iran hopefully embrace the ceasefire.
Some of these ideas are in our clients’ portfolios. To understand if this one can work for you or for help to invest your own wealth, talk to our advisors at FM Capital Group. Would you like more information on how to get commodities in your portfolio? Schedule a meeting with us here