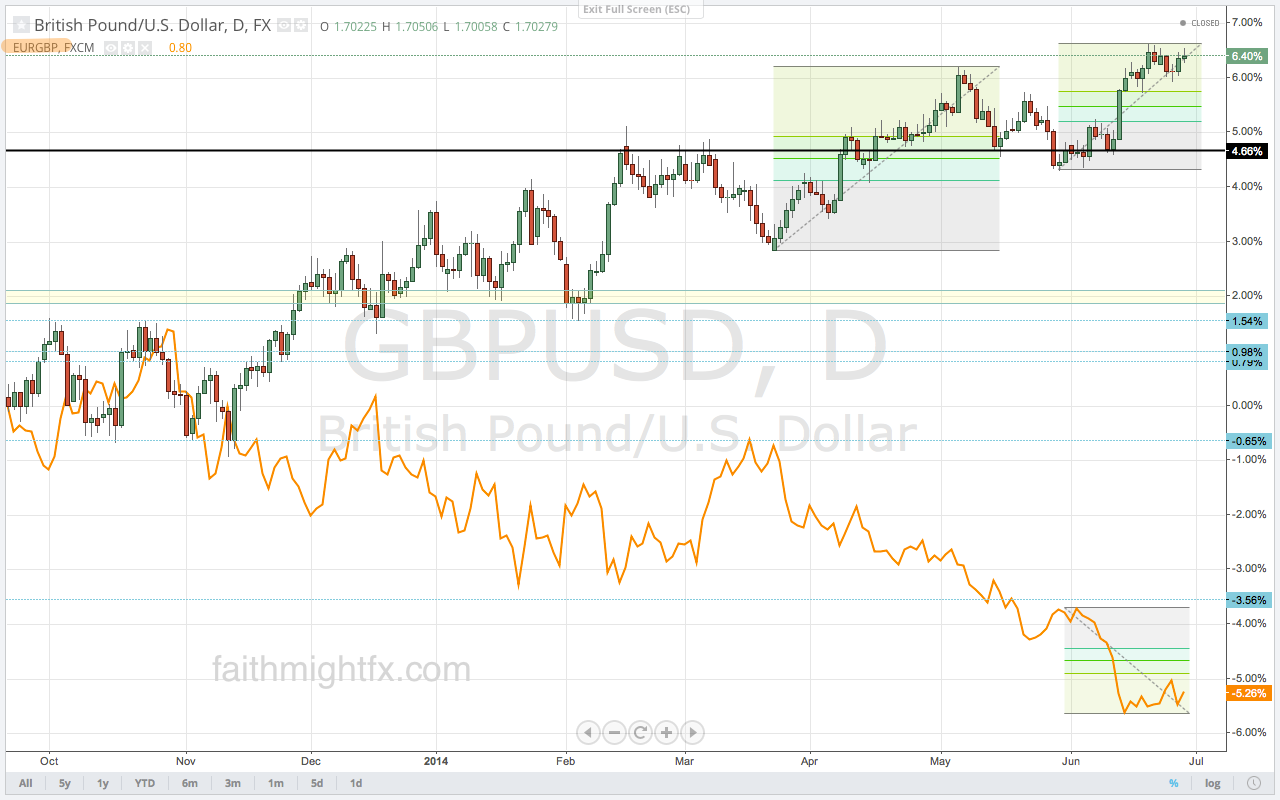
Forex traders love to compare the cross currency pairs to the major currency pairs. Even those of us who are firmly in the camp that you trade each chart in and of itself, also like to conspire every now and again. The $GBPUSD has been moving higher all year, closing last week again above 1.70. The $EURGBP, however, closed back above 0.80 after already retracing 38.2% last week. Up until this week, sterling had been trading with good strength in both pairs. Two weeks ago, both $GBPUSD and $EURGBP closed above/below their respective big fig levels. Was Friday’s divergent close a signal of a decline in sterling?

Looking at this $GBPUSD vs. $EURGBP comparison chart, we see that these pairs tend to move inversely to each other especially during bouts of GBP strength. This rally of the last several months is no exception. With $GBPUSD already poised at the beginnings of another leg higher, the close above previous its highs is really bullish. If we see new highs in cable this week, we should see $EURGBP move towards the lows again despite the close above 0.80. Likewise, if we see new lows in $GBPUSD on a hold of 1.7050 resistance, perhaps $EURGBP confirms the Friday close and does shoot higher. Mind the calendar and trade what you see.
Leave a Reply