In 2018, Tesla stock opened at 316.64 and closed at 323.31. During the year, there were several highs and lows but resistance was maintained at 380.66 and support level was at 249.36. This technically signifies about 130points from the support to the resistance level. Last year, the highest point of $TSLA shares was in the second trading week of December at 380.66. The first day of trading in 2019 started with a dip in the share price of $TSLA. The price of $TSLA has been touching the resistance level several times in the past 8 months. Buyers are more active with the $TSLA stock. A breakout upward from the resistance level could lead to a major bullish movement on the stock. Market price of $TSLA opened at 305.53 this year. Since then, it tried to retrace upward to the closing price of 2018 at 332.36
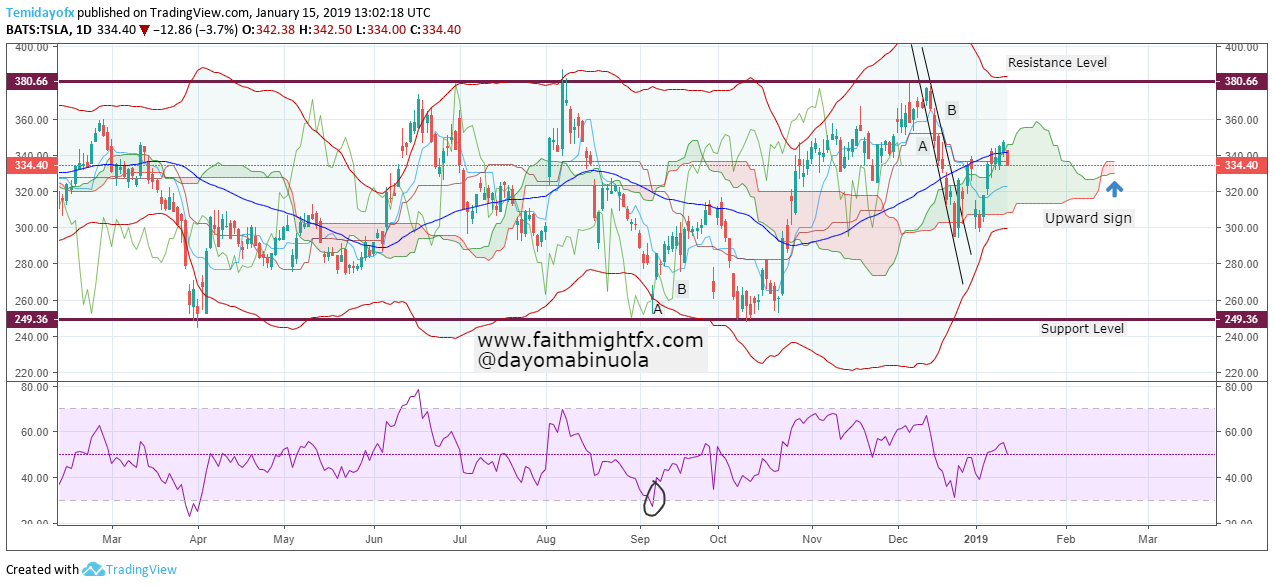
RSI is yet to show an oversold reading despite a dip in momentum on the daily chart. RSI also shows momentum is currently above 50 on the RSI chart which indicates a bullish trend might begin soon. At the beginning of the week, momentum was bearish which might be an indication for the bulls to buy the downward movement. Ichimoku’s future shows a sign indicating a bullish trend might begin soon. The current price of $TSLA is at 334.40. Eventually with all these indications, if price of $TSLA continues to remain bullish, the resistance 380.66 might be reached.