In the first week of October 2018, S&P 500 reached an all time high of 2946.97 before a reversal began. Before then, there was an indication of an oversold region in January 2018 on the weekly chart and price of $SPX moved downwards with 500points. Also, before the end of 2018, price was beginning to gain momentum through the active roles of the bulls.
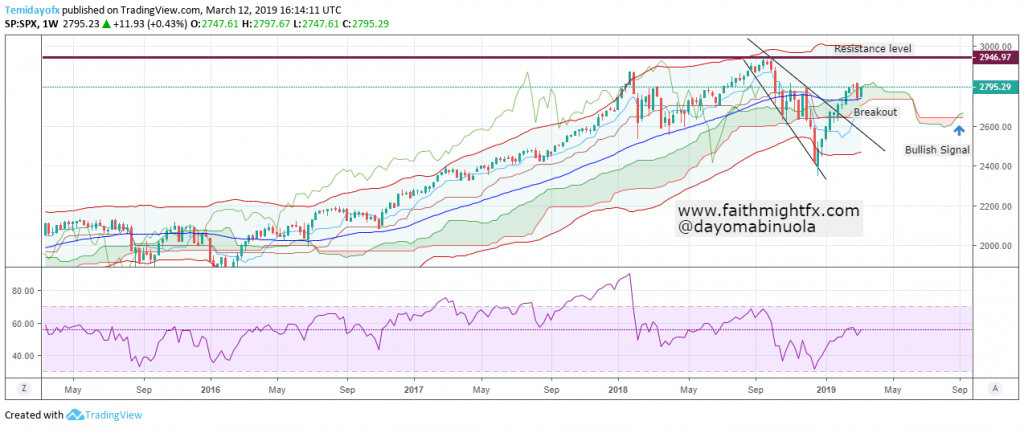
Despite the selloff on the weekly chart, $SPX never showed an oversold position on the RSI before price rallied. A breakout from the trendlines which has occurred might be a strong signal for a bullish continuation move towards the resistance level. The future of Ichimoku has already given us a signal for a complete bullish takeover. In the second trading week of February, price of $SPX moved to the upper region of the Bollinger bands and it is yet to reverse. $SPX bulls might push price to 2946.97, the all time high.