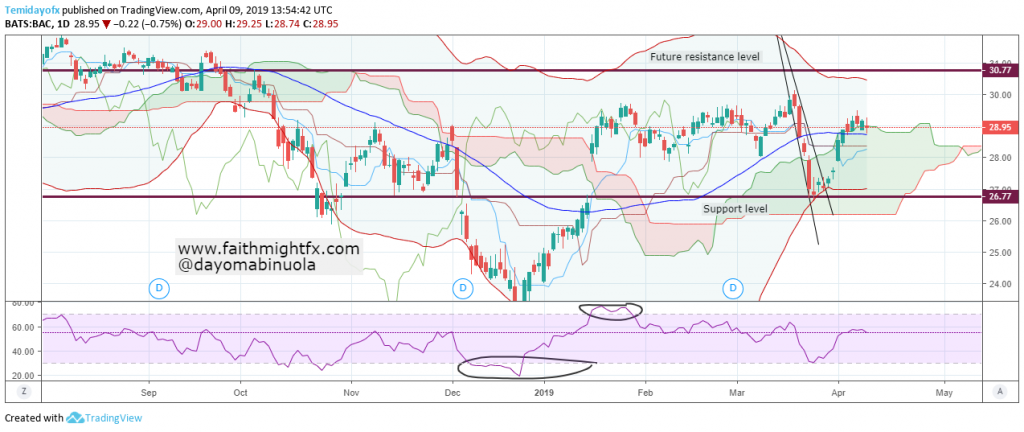
In December last year, Bank Of America share price was as low as 22.73. As the American market went down towards the end of 2018, $BAC also joined in the dip. After this dip, price rallied to the 26.77 level, which initiated to a strong support. There was a gap up on the 16th of January which made price to reach 29.64. After this gap up, a correction has occurred but the price of $BAC was not able to break the support level at 26.77.

The correction after the gap up made price to cross to the lower region of the Bollinger bands. The trendlines have been broken and indications show a bullish takeover begins. Though we expect the $BAC bulls in the market, Ichimoku has not shown a bullish signal but showed a bearish signal instead. On the daily chart, price of $BAC is overbought. Price being overbought might be deceptive for the bears to get into the market. Currently, price of $BAC has been able to cross to the upper region of the bands. So price of $BAC could reach the next resistance level at 30.77 from its current 28.95.
Leave a Reply