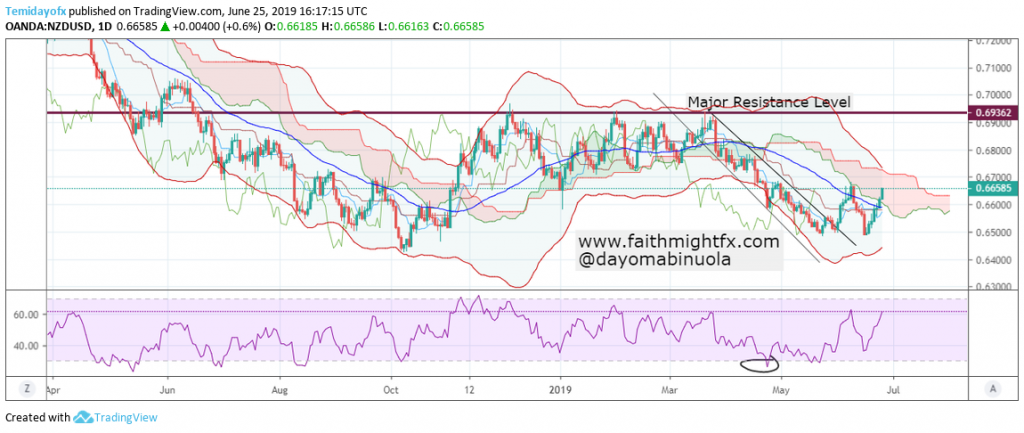
There has been low volatility with the $NZDUSD pair from December 2018 to the end of March 2019. Towards the end of March, the dip in price made $NZDUSD reach 0.64896 from the major resistance of 0.69362. The trendlines have been broken to the upside indicating a change of trend. In the first week of June, price was able to reach the middle line of the Bollinger bands. It tried to break it before a correction occurred.

As it stands, in the last two trading days, price was able to break the middle line to the upside. The bulls might have been able to gather momentum for a complete bullish movement. RSI before the breakout from the trendlines has shown oversold positions. The NZD is presently gaining strength against the USD. Price of $NZDUSD might go back to the resistance level of 0.69362 in the next few weeks. Ichimoku still shows the bears are in charge. Though $NZDUSD price is presently in the cloud with the bulls in charge, a breakout from the cloud upwards might conveniently push price to 0.69362.
Leave a Reply