I have been harping on USD weakness for months now (here and here and here). Amazingly, during that time with poor U.S. economic data releases and stocks recovering, the USD has remained rangebound. Bouts of weakness have been met with strong bouts of buying since April. When looking at the $GBPUSD, the 1.2634 resistance level has remained that line in the sand for buyers and sellers. Until we get a break above 1.2634 that stays above the 1.2775 resistance level, we won’t see sustainable selloff in the USD.
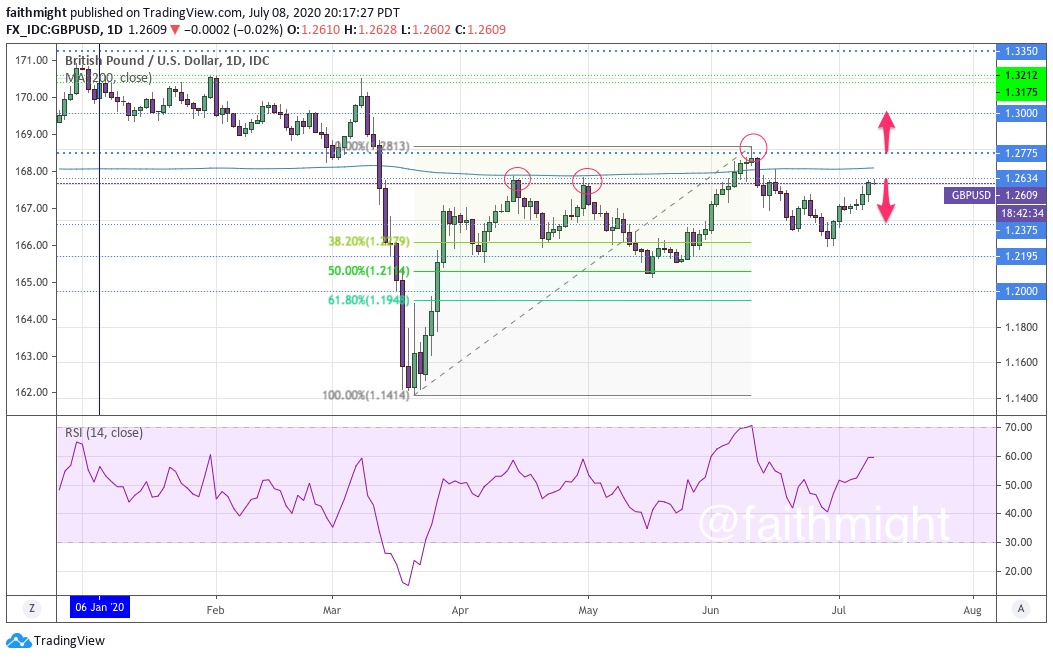
Despite the jockeying between buyers and sellers, the $GBPUSD is trending higher with higher lows and higher highs. This indicates that the USD does continue to weaken more and more. A hold above the 1.2775 resistance level will see the $GBPUSD head towards the highs on the daily chart above the big 1.3000 level. However, another false break above 1.2634 could send $GBPUSD back into a correction that targets the 50% Fibonacci level at 1.2114 or lower.
If you are interested in learning how to find and use these levels in your trading, please check out the CHARTS101 course. Read the charts for yourself so you can trade what you see and not what I think.