During the lockdown in 2020, EURGBP reached a new high at 0.95043. That was the highest point for EURGBP since March 2009. Since that high in 2020, the Pound has been gaining against the Euro. As a result of the price fall, the resistance level of EURGBP in 2021 was at 0.87240. And the lowest price for that year was 0.83680.

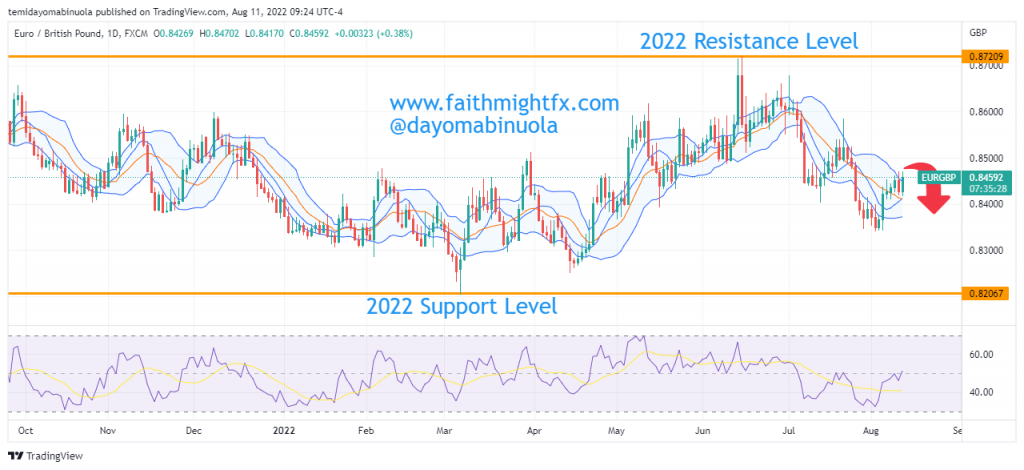
EURGBP opened in 2022 at 0.84026. For the first quarter of the year 2022, price was in a range. Despite the range, a new low was seen at 0.82036. As we entered into the second quarter, there was a breakout from the range to the upside. This breakout led to price reaching 0.87227 in June and it currently is the resistance level for 2022.

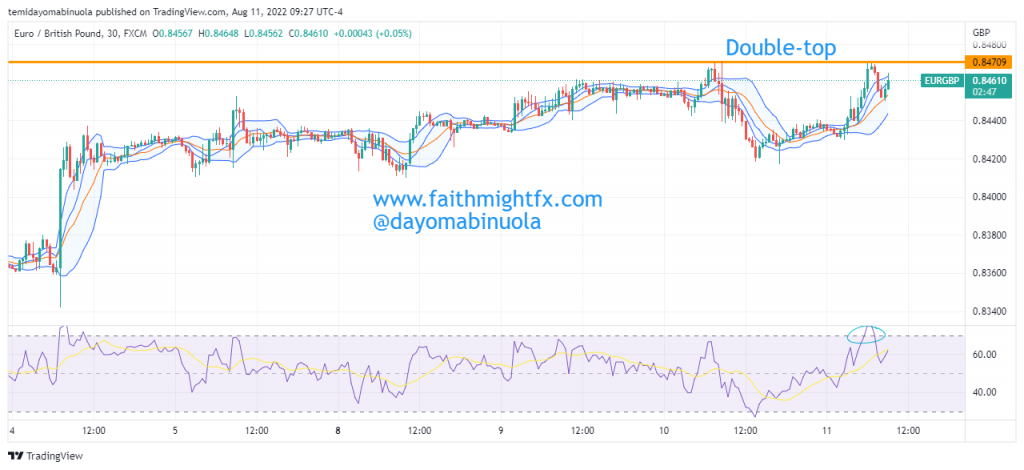
On the same day the resistance level was reached in June, price began to fall. As at the time of publishing this article, EURGBP stands at 0.84609. Looking at the daily chart, the price has been characterized by lower highs and lower lows. EURGBP is currently on a lower high with a support level at 0.83396. In the next few days or weeks, we might be seeing a lower low which could break that support level to the downside. RSI on the 30-Minute Timeframe shows that price is overbought.
Some of these ideas are in our clients’ portfolios. To understand if this one can work for you or for help to invest your own wealth, talk to our advisors at FM Capital Group. Would you like more information on how to get currencies in your portfolio? Schedule a meeting with us here

Leave a Reply