According to CNBC, the Russia-Ukraine war has remapped the world energy supplies, putting the United States at the top for years to come. This week new data from the U.S. government showed the U.S. exported a record 11.1 million barrels a day of oil and refined products. Not since the aftermath of World War II has the U.S. been so important as an energy exporter.
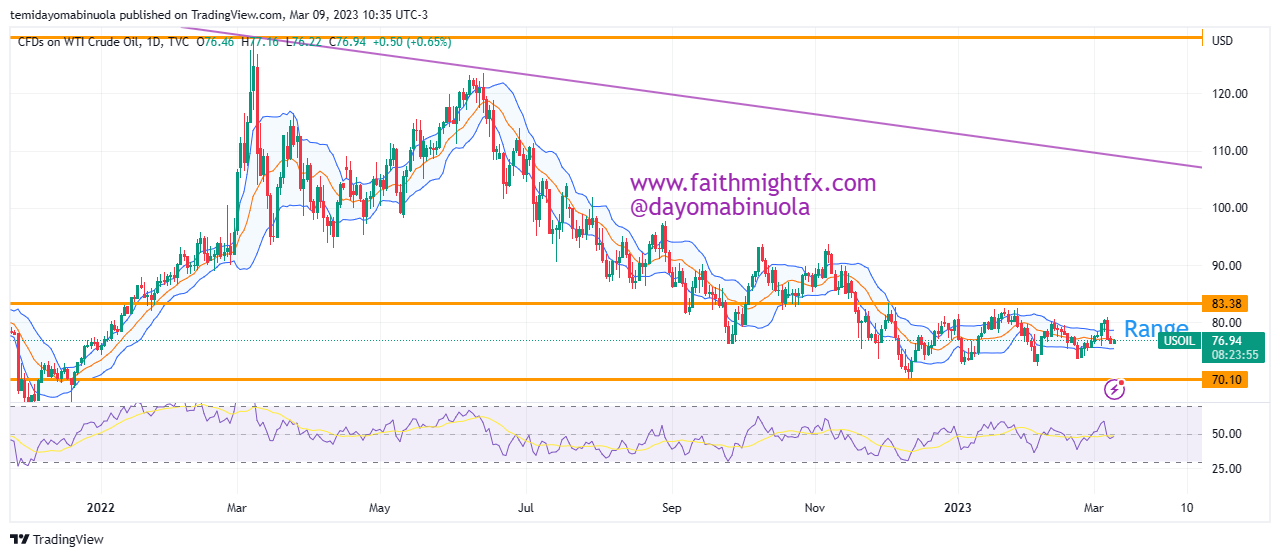
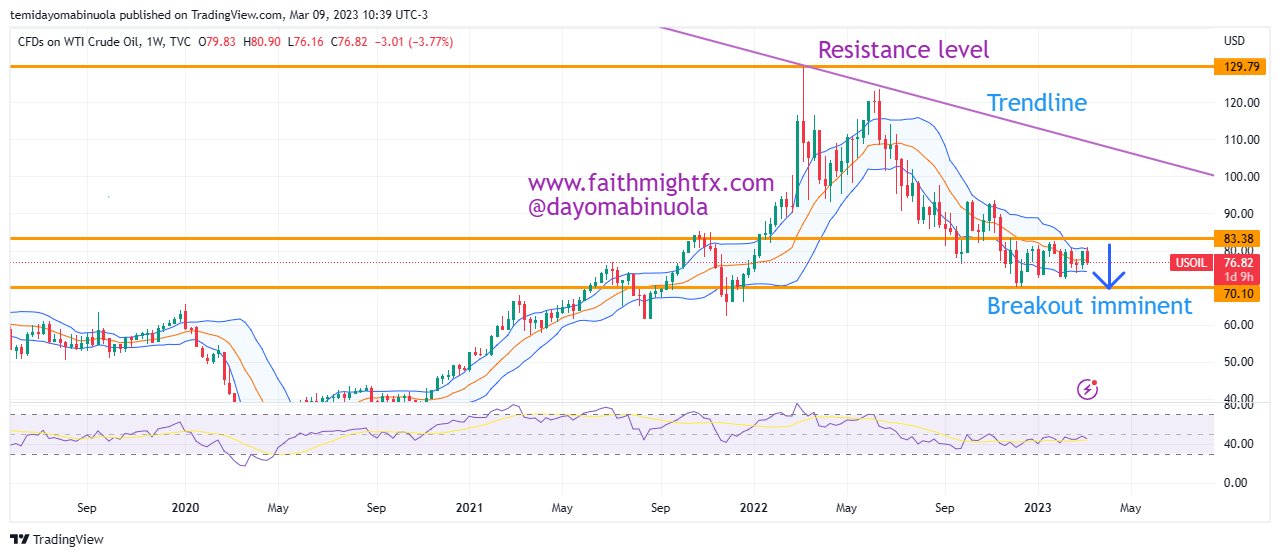
Since November 17, 2022 up until, the WTI price has been locked in a range between $70.10 and $83.10. A breakout might occur to the downside in the coming weeks as price could fall below $70. Since the beginning of 2021, RSI has indicated that price has been overbought five times on the weekly chart.
Some of these ideas are in our clients’ portfolios. To understand if this one can work for you or for help to invest your own wealth, talk to our advisors at FM Capital Group. Would you like more information on how to get commodities in your portfolio? Schedule a meeting with us here