Author: @dayomabinuola

  • Are Udemy Investors Caught In A Bear Trap?

    Are Udemy Investors Caught In A Bear Trap?

    Udemy is a massive American open online course provider. It was founded in 2010 and by April 2021, the platform had recorded more than 40million students, 155,000 courses and 70,000 instructors in over 65 languages. As of 2022, Udemy has over 52milion users. Between 2011 and 2020, Udemy made some series of fund raising. The last funding before the IPO in 2021 was for $50million at $3.2billion valuation led by Tencent Holdings.

    Weekly Chart

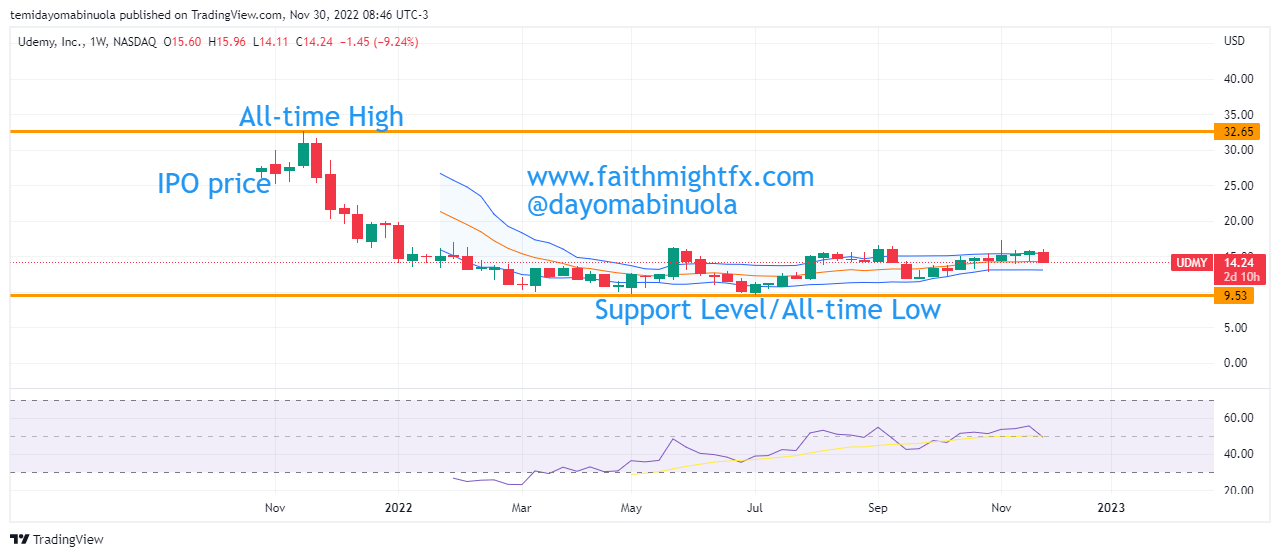
    On October 29, 2021, Udemy held their IPO with a price of $27 per share. Price of $UDMY rallied only for a few weeks from its IPO to reach an all-time high at $32.68 on the 19th of November 2021. The next trading day after the all-time high was reached, the bears took full control and price began to dip and closed below the IPO price even before the end of November 2021.

    Monthly Chart

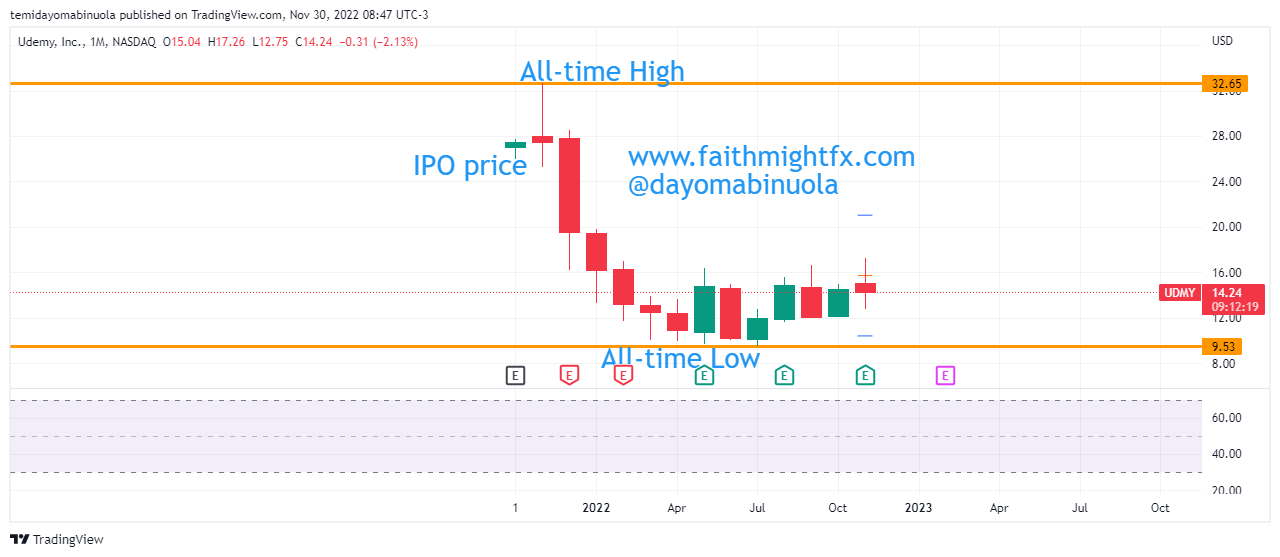
    The opening price of this year was at $19.51. as price, it has also been a year of low volatility, though the first four months closed bearish. The price of $UDMY in 2022 has been between $19.84 in January, which is the highest price level in the year and  $9.47 in July, which also stands as the all-time low. Udemy share price right now is at $14.24 and we might be seeing a price fall to $11.79 in the coming weeks.

    Some of these ideas are in our clients’ portfolios. To understand if this one can work for you or for help to invest your own wealth, talk to our advisors at FM Capital Group. Would you like more information on how to get stocks in your portfolio? Schedule a meeting with us here

  • Credit Suisse In Worst Ever Bearish Run

    Credit Suisse In Worst Ever Bearish Run

    Founded in 1856, Credit Suisse Group AG, Credit Suisse for shorts, is a global investment and financial services firm based in Switzerland. It is not only listed locally on the Swiss Stock Exchange, and it is also listed on the London Stock Exchange and New York Stock Exchange.

    Monthly Chart

    In September 1995, Credit Suisse Group AG got listed on NYSE at an IPO price of $22.93. Since the IPO, Credit Suisse bulls have been able to push price to an all-time high at $77.38 in April 2007. Since this all-time high, the bears have steadily gained control of the price movement as price dipped to $17.94 i.e. below IPO, in March 2009.

    Weekly Chart

    From March 2009, there was a rally to October of that same year that took price to $58.69. However, since then, Credit Suisse has nosedived as share price hit a record low of $3.37 yesterday, November 28, 2022. According to Bloomberg, this is the investment bank’s worst bearish run ever. According to our analysts, Credit Suisse share price is expected to bounce from this point to $6 soon.

    Some of these ideas are in our clients’ portfolios. To understand if this one can work for you or for help to invest your own wealth, talk to our advisors at FM Capital Group. Would you like more information on how to get stocks in your portfolio? Schedule a meeting with us here

  • Goldman Sachs On A 6-Week Rally

    Goldman Sachs On A 6-Week Rally

    On the first trading day of the year 2022, Goldman Sachs share price opened at $387.10. The bulls only enjoyed a few days of rally as price reached the year’s high at $413.33. This mark was hit on the 5th of January which was the third trading day of the year.

    Daily Chart

    Following this rally that took price to the year’s high, the bears have been in control of the price movement causing a dip in price. This dip has seen Goldman Sachs’ price sink to hit the year’s low at $278.19 in July 2022. The last time price went this low was in January 2021. It is worthy of note that Goldman Sachs hit its all-time high in the same year 2021 at $426.50.

    In the second half of this year, the bulls have become more active. There was a bounce from the year’s low to $359.50 in August 2022, which was also the initial resistance for the second half of 2022. When this resistance was hit, there was a correction on the weekly chart which caused price to fall below $300 for the second time in the year. 

    Weekly Chart

    In October 2022, the bulls regained control of the price movement sending Goldman Sachs’ share price on a 6-week jolly ride upward. Price is currently at $379.14, which is the resistance level on the weekly chart. Although, RSI indicates price is overbought on the daily chart, it does not indicate that it is overbought on the weekly chart. Our analysts believe that this rally is strong enough to take Goldman Sachs’ share price to a new all-time high.

    Some of these ideas are in our clients’ portfolios. To understand if this one can work for you or for help to invest your own wealth, talk to our advisors at FM Capital Group. Would you like more information on how to get stocks in your portfolio? Schedule a meeting with us here

  • Solana Hits All-time Low

    Solana Hits All-time Low

    Since the Solana project was launched in 2021, the first four months were all bullish. Solana had its ICO at $25 and in the space of those four months, it rose to an all-time high of $260. But just like other cryptocurrency assets in 2022, the price of Solana has fallen dramatically.

    Daily Chart

    Investors in crypto have not seen profit in 2022 as many crypto assets have been dipping. Solana’s year’s low is $12.245 which was reached earlier this month, and this currently stands as the all-time low for this cryptocurrency. 

    Weekly Chart

    Currently, there is a consolidation in motion. However, there are no indications of a rally resulting from this consolidation. On the daily chart, price is currently oversold on the RSI. But there are no indications on the RSI weekly chart that price is oversold.

    Some of these ideas are in our clients’ portfolios. To understand if this one can work for you or for help to invest your own wealth, talk to our advisors at FM Capital Group. Would you like more information on how to get cryptos in your portfolio? Schedule a meeting with us here

  • Silver Price Rallies From Year’s Support

    Silver Price Rallies From Year’s Support

    Between 2014 and 2020, Silver ranged between $11 and $21 per ounce. A breakout of the 6-year resistance occurred as a result of the ease of lockdown in the second half of 2020. This breakout led to Silver rallying to $29 per ounce.

    Weekly Chart

    Since the rally to $29 in July 2020, the bulls have found it difficult to get Silver to exceed that $29 mark. The bears have continued to dominate the charts and price was pulled down to $17 in late August 2022. The last time the price of Silver was $17 was in July 2020.

    Daily Chart

    Silver’s current support level is $17. A bounce from this support level occurred early in September 2022 and price is now at $21. We might be seeing Silver lose a few points in the coming weeks and the commodity could fall to $19 per ounce.

    Some of these ideas are in our clients’ portfolios. To understand if this one can work for you or for help to invest your own wealth, talk to our advisors at FM Capital Group. Would you like more information on how to get commodities in your portfolio? Schedule a meeting with us here

  • Robinhood Share Price Falls, To Reach A New All-Time Low

    Robinhood Share Price Falls, To Reach A New All-Time Low

    Robinhood Markets, Inc. is an American financial services company, with her headquarters in California. It’s a FINRA-regulated broker-dealer, registered with the U.S. Securities and Exchange Commission. As of March 2022, Robinhood had 22.8million funded accounts and 15.9million monthly active users. In April 2022, Robinhood introduced a cryptocurrency wallet to more than 2 million users.

    Weekly Chart

    Most Robinhood investors would be in losses, except for those investors with new entries from June 2022. Robinhood had its IPO at $37.87 in July 29, 2021. The stock rallied for just few days, as price eventually reached an all-time high at $85.15 on the 4th of July, 2022. Since its IPO, only the first five trading days were in favor of the $HOOD bulls. Since November 17, 2021, Robinhood has been trading below the IPO price at $37.87.  

    Daily Chart

    2022 has been a bearish year for $HOOD investors. The current price of $HOOD shares is at $9.74. The all-time low for Robinhood is at $6.71, which was hit in June 2022. Recently, the crypto industry witnessed another crash. We might be seeing another drop in the price of $HOOD, which could eventually make the price reach a new all-time low below $6.71. We might be seeing price reach $6 or $5 per share.

    Some of these ideas are in our clients’ portfolios. To understand if this one can work for you or for help to invest your own wealth, talk to our advisors at FM Capital Group. Would you like more information on how to get stocks in your portfolio? Schedule a meeting with

  • Apple and Saudi Aramco Still Above $2Trillion Market Cap Despite Market Dip

    Apple and Saudi Aramco Still Above $2Trillion Market Cap Despite Market Dip

    The world is yet to fully recover from the damage Covid-19 wreaked on the stock market. A few companies have been able to increase their market capitalization despite the global economic downturn during and post global lockdown. Only four companies have a market capitalization of over one trillion dollars. These companies are Apple ($2.201 trillion), Saudi Aramco ($2.046 trillion), Microsoft ($1,650 trillion) and Alphabet ($1.121 trillion).

    Amazon Chart

    As of January 2022, Apple became the first publicly traded company to reach $3trillion. Both Amazon and Tesla have surpassed $1trillion in the past, but due to the recent stock market crash, their market caps are currently at $928.15Billion and $645.43Billion respectively. The first company to ever reach $1trillion market cap was PetroChina but the gas company is currently at #122.05Billion in market cap.

    Google Chart

    Saudi Aramco tops the list of highest earners among the publicly traded companies with $279.3Billion. With the hike in inflation rate in many countries of the world, the stock market might not appreciate this year. The next major rally for global stocks could occur in 2023. By this time, we will have more companies with market cap of over $1trillion.

    Apple Chart
    Saudi Aramco

    Some of these ideas are in our clients’ portfolios. To understand if this one can work for you or for help to invest your own wealth, talk to our advisors at FM Capital Group. Would you like more information on how to get stocks in your portfolio? Schedule a meeting with

  • Airbnb Price Bounces From All-Time Low

    Airbnb Price Bounces From All-Time Low

    AirBnB had its IPO in December 2020 at $145 per share. This IPO was done a few months after the ease of lockdown globally. Price rallied to $219, an all-time high, on February 11 2021. The rally was short-lived as price fell to $129.49 in May 2022, which was below the IPO price. There is a report that indicates that travel around the world is starting to slow because of high energy prices, and consumers are having a second thought before going on vacation. The housing market is currently in turmoil, which could spill over to the AirBnB market.

    Monthly Chart

    Since the beginning of the year, AirBnB has been down by 32.46%. As a result of the fall, price crossed the $100 psychological level for the first time as it hit $85 in July 2022. Price is consolidating on the weekly chart, as the price of $ABNB is currently at $110.30. A rally to $196 might occur in the coming months.

    Daily Chart

    Some of these ideas are in our clients’ portfolios. To understand if this one can work for you or for help to invest your own wealth, talk to our advisors at FM Capital Group. Would you like more information on how to get stocks in your portfolio? Schedule a meeting with us here

  • Meta Falls Below $100 For The First Time Since 2016

    Meta Falls Below $100 For The First Time Since 2016

    Meta is one of the world’s most valuable companies. As of 2021, the revenue was over $117billion. Mark Zuckerberg is the controlling shareholder of Meta. In October 2021, Meta changed its name from Facebook. Meta reached an all-time high at $384.33 in August 2021. All months in 2021 closed bearish except for March and April 2022. The Bulls are having a hard time with the continuous downtrend movement since 2021 all-time high.

    Weekly Chart

    Meta’s share price closed at $130.28 on the 26th of October, but opened today, the 27th of October at $98.04 as a result of a gap-down. On the Daily Chart, RSI shows price has been oversold in September and October. A price rally might occur, which could close the gap down and price could reach $120.

    Monthly Chart

    Some of these ideas are in our clients’ portfolios. To understand if this one can work for you or for help to invest your own wealth, talk to our advisors at FM Capital Group. Would you like more information on how to get stocks in your portfolio? Schedule a meeting with us here

  • New Entry Point for Potential Investors In Alphabet Inc. Stock

    New Entry Point for Potential Investors In Alphabet Inc. Stock

    The downward price movement has not been favorable to Alphabet investors since the beginning of this year. Potential Alphabet investors must be looking out for best entry points, but the price keeps moving around the year’s support level at $95.25. The opening price of Alphabet at the beginning of this year was at $144.54, with the first month of the year closing bearish. There was a temporary rally in February that made price hit $152.07, making it the year’s high and also the all-time high.

    Daily Chart

    The price movement since the all-time high was reached has been characterized with lower-highs and lower-lows. The year’s low is currently at $95.58. The market opened today, the 26th of October, and as a result of a gap down, the price is at $96.89, from $104.93 where it closed yesterday. The gap down might be closed in the coming weeks as price rallies to reach $100. If Price eventually reaches $100, this might be a good entry point for potential investors in Alphabet Inc. as price makes its way to $138.

    Weekly Chart

    Some of these ideas are in our clients’ portfolios. To understand if this one can work for you or for help to invest your own wealth, talk to our advisors at FM Capital Group. Would you like more information on how to get stocks in your portfolio? Schedule a meeting with us here