Microsoft investors have enjoyed bull runs for 13 years as the lowest price within that time frame was at $15.10. Despite the worldwide lockdowns and the negative impact on many stocks across the world, Microsoft’s share price didn’t see a major reversal. What the Microsoft share price saw, at worst, were corrections.
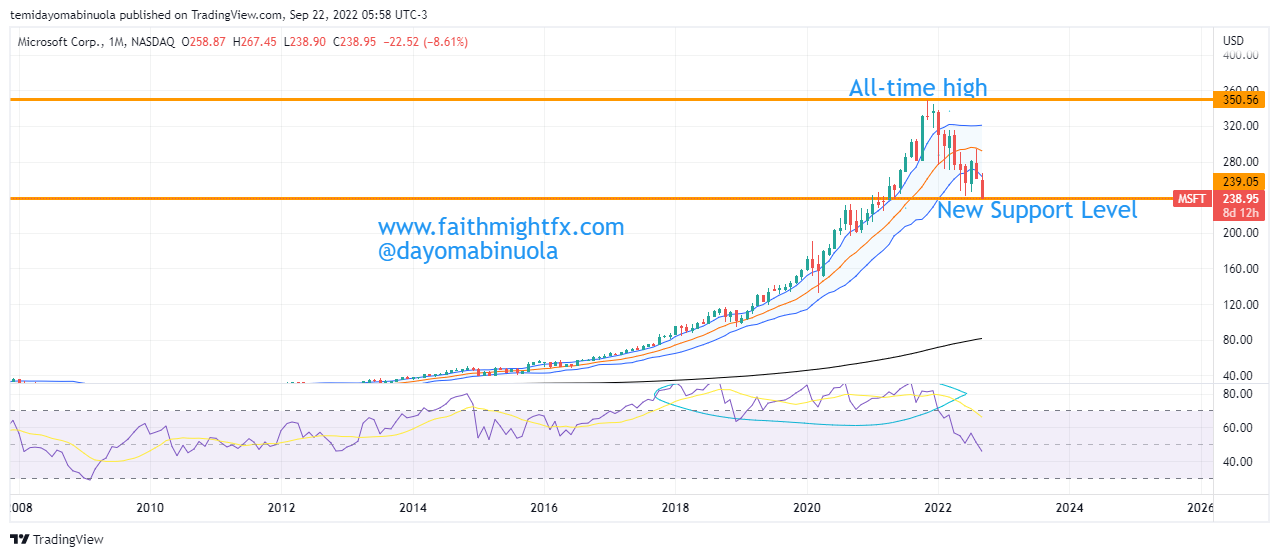
In fact, during the lockdown, Microsoft saw a correction between February and March after which it began to rise. This rally continued up until November 2021 as price reached $350, which stands as the all-time high. After this all-time high was reached, the activities of the bears can be likened to those in 2008 as price is currently at $238. Also, since 2015 using the monthly time frame, this is the first time four candlesticks will be seen in the lower region of the Bollinger Bands.
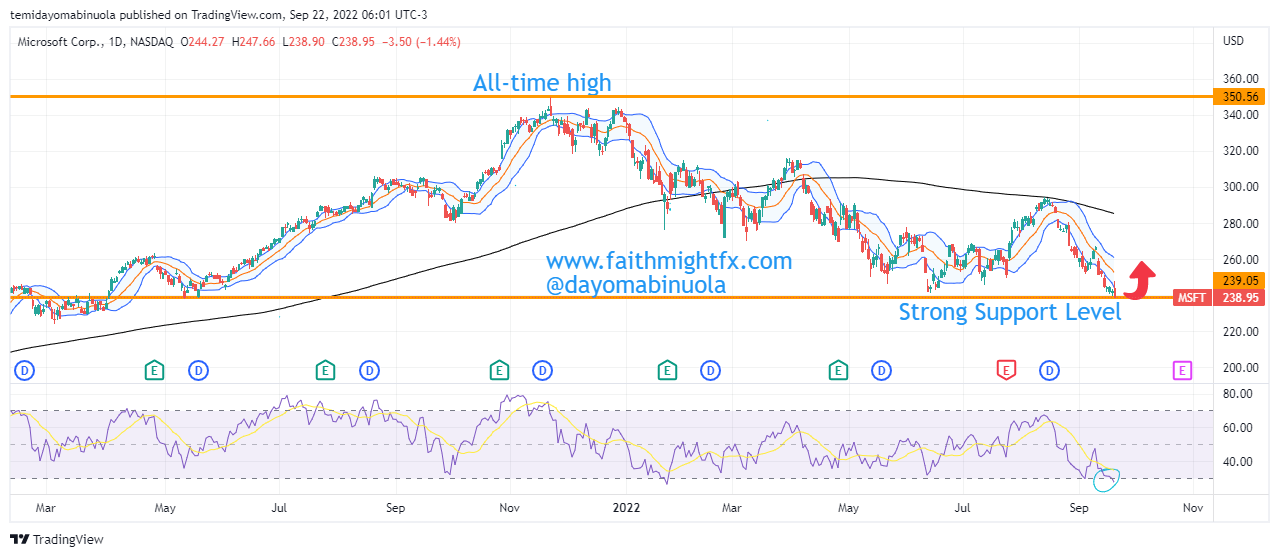
We might be seeing a rally to $250 per share in the next few weeks. The 4H timeframe at two different times in September shows that price has been oversold. This could be an indication for the next appreciation in price.
Some of these ideas are in our clients’ portfolios. To understand if this one can work for you or for help to invest your own wealth, talk to our advisors at FM Capital Group. Would you like more information on how to get stocks in your portfolio? Schedule a meeting with us here