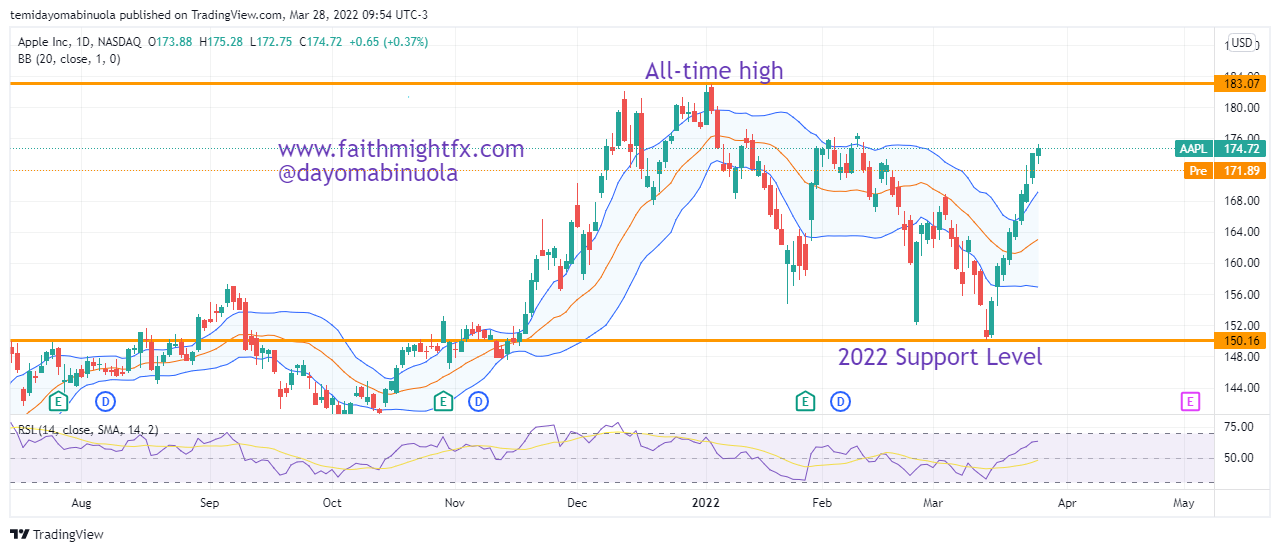
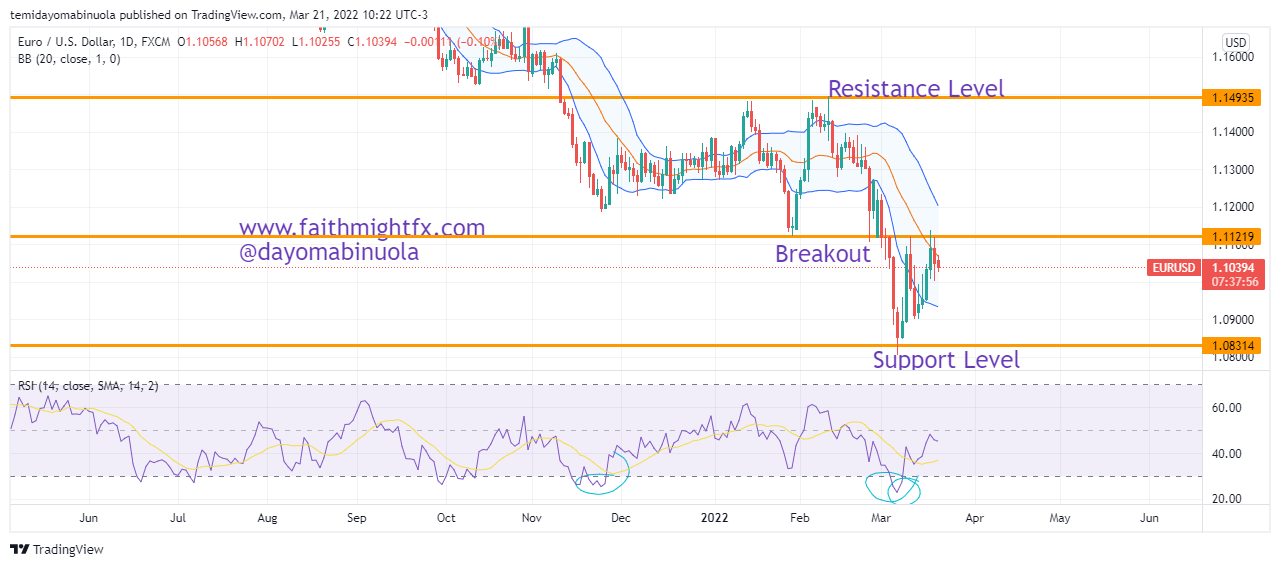
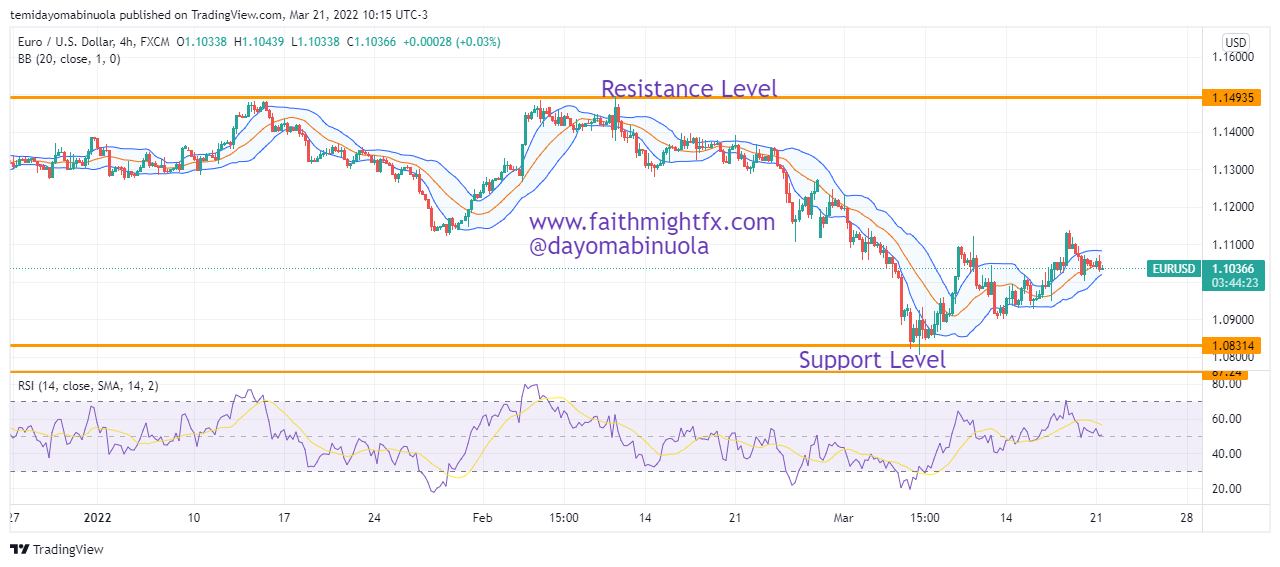
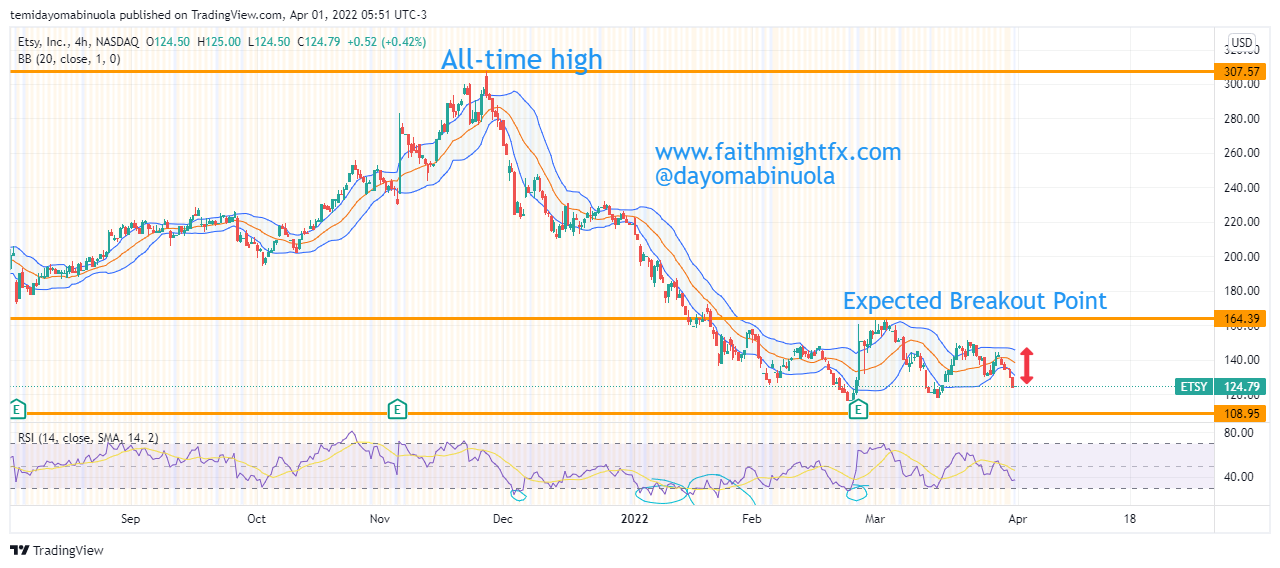
American e-commerce company, Etsy, began to suffer a big loss in share price after an all-time high was reached at $307.57 on December 26, 2021. $ETSY has lost about $200 since its all-time high last year December. The bears have been more active since the beginning of the year 2022. Etsy opened the year 2022 at $222 but has since lost about $100, leaving it at $124.28 as at April 1, 2022.
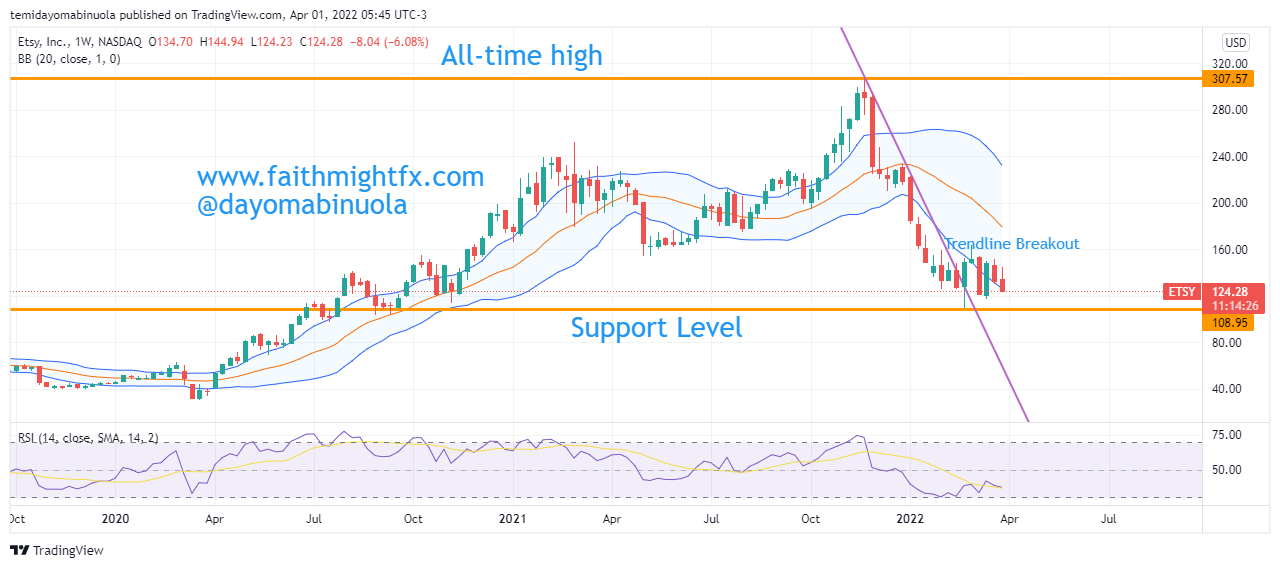
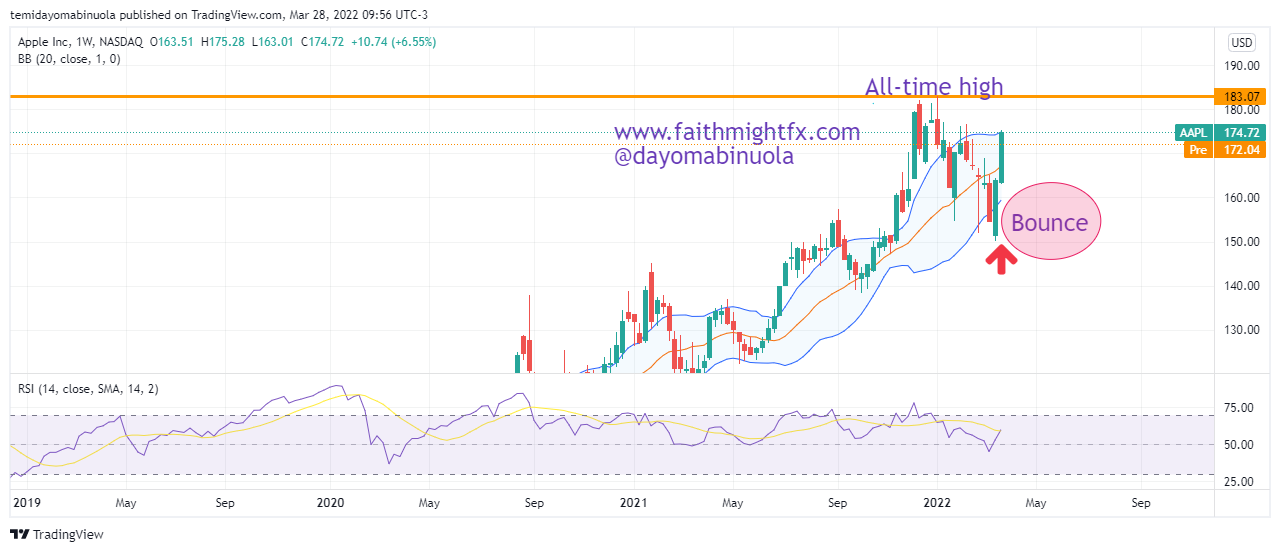
In the past 5 months, there have been several indications of the price being oversold on the Etsy 4hr Chart . Etsy’s previous support level on the weekly chart was maintained at $155.15 since May 2021. The recent downward slide this year has made Etsy reach a new support level at $108.95 as of February 24, 2022. The next bull run for Etsy might make the price reach $278, which is over $105 gain from its current price. In a situation where the bulls continue to push prices higher than $278, a new all-time might be reached. As price consolidates, a breakout to the upside above $164, could be the clue for the next bull run.
Some of these ideas are in our clients’ portfolios. To understand if this one can work for you or for help to invest your own wealth, talk to our advisors at FM Capital Group. Would you like more information on how to get stocks in your portfolio? Schedule a meeting with us here.