Author: @dayomabinuola

  • Apple Investors Continue To Make Profit

    This week is the best week so far for Apple since the beginning of the year. The share price appreciated on Wednesday by over 2.8%. It has been up 8% this week and about 6% this month. The supply chain shortages are getting worse though as Apple completely stops iPhone production in China for the first time in a decade.

    Daily Chart

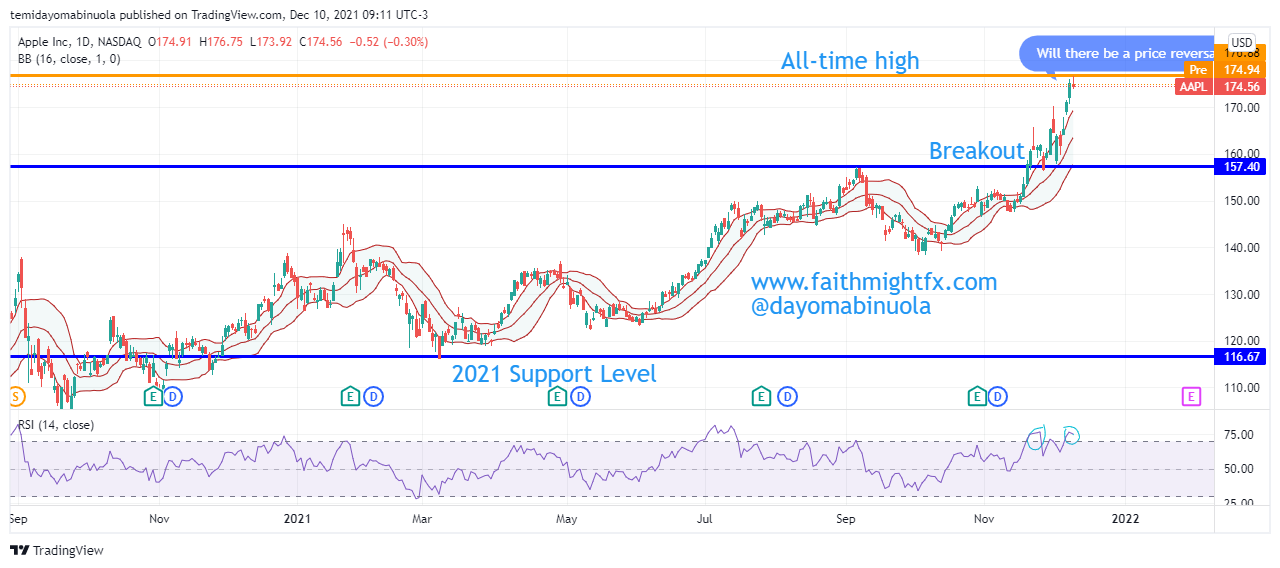
    Just like many other stocks, Apple’s share price dipped during the lockdown from then $81.53 to $53.65, which was a 34% loss in value at that time. As the lockdown was eased last year, the price has continued to rally from the lowest price level at $53.65 to a new all-time high this month at $176.65. That is over 2X gain since the ease of lockdown. The last year has been the best year for the Apple investors as more gains are made. The current market cap for Apple is $2.86 trillion. Apple could be the first company to reach the $3trillion market cap.

    Weekly Chart

    Now that Apple has completely stopped the production of Iphones in China, this might lead to the share price taking a break from the rally. Apple has been sued over Apple watch defect that poses hazards to customers. RSI has shown that the price has been overbought twice between November and December. Price is currently in the upper region of the Bollinger bands, a correction might occur if the Omicron virus poses a major threat to the global populace.

    Some of these ideas are in our clients’ portfolios. To understand which ones can work for you or for help to invest for your own wealth, talk to our advisors at FM Capital Group. Would you like more information on Investment Advisory, Portfolio Services, and VC? Schedule a meeting with us here.

  • Price Of Dow Jones Heads To A New All-Time High

    During the sharp drop in the price of Dow Jones in 2020, which was majorly caused by the global lockdown, the price fell from $29,473 to $18,000. Since the ease of lockdown, the price has continued to rally as most of the months in 2021 had a new all-time high. There was a breakout of the previous all-time high at $29,473 towards the latter part of the year 2020. Since this breakout, the bulls have been relentless. The opening price of Dow Jones at the beginning of the year was $30,489. Price has been able to reach a new all-time high at $36,598. There was a major dip in November 2021 when the price from the all-time high at $36,598 to $34,000. Then a rally occurred which is a result of a gap up. The 4hr chart clearly shows the price is currently in the upper region of the Bollinger bands.

    There are likely possibilities of price reaching a new all-time high above $36,598, which could lead to a breakout of the resistance level. Almost all losses last month have been recovered with December’s price reversal. The gap down from $35,800 to $34,800 in November 2021 has been covered up with this bullish run this month. RSI was able to show that the price had been overbought in the previous all-time high in November 2021. As the price dips in November before consolidating, RSI also shows that price has been oversold, which was an indication of a price reversal.  On the daily chart, the candlesticks crossed to the lower region of the bands in November as the price fell. Yesterday’s candlestick closed in the upper region of the Bollinger bands. This move could push the price to the next psychological level at $37,000.

    Some of these ideas are in our clients’ portfolios. To understand which ones can work for you or for help to invest for your own wealth, talk to our advisors at FM Capital Group. Would you like more information on Investment Advisory, Portfolio Services, and VC? Schedule a meeting with us here.

  • Why Did Pfizer Lose 5% In Value?

    Pfizer is an American multinational pharmaceutical and biotechnological corporation. The company was established in 1849 and went public at the beginning of 1968 at an opening price of $0.42. Over the years, the share price of Pfizer has appreciated in several multiples. The Pfizer investors have enjoyed a rally over the years as the price keeps appreciating. The previous all-time high at $44.01 was reached in 2018 and maintained until the price broke out to the upside to new all-time highs in August 2021 and December 2021 respectively. Pfizer was licensed to produce the vaccine as a result of the necessity caused by the spiking cases of coronavirus across the world. Despite the share price of Pfizer going low as $26.37 in 2020, after it reached the all-time high in 2018 at $44.01, millions of persons worldwide got vaccinated with the Pfizer vaccine which must have led to the share price appreciating.

    Weekly chart

    The most recent all-time high of $PFE was reached in November 2021 at $55.83. Some scientists might have been saying that the Omicron variant of the coronavirus is of less concern. Just like many vaccine-producing companies, $PFE’s share price dropped 5.14% yesterday. Despite a few lockdowns across the world and some countries restricting flights from some other countries, there seems to be a correction occurring with the price of $PFE. The share price of Pfizer might drop to $41.93 which is around the previous support level at $41.10, as some scientists have said the Omicron variant is not of major concern.

    4hr Chart

    Some of these ideas are in our clients’ portfolios. To understand which ones can work for you or for help to invest for your own wealth, talk to our advisors at FM Capital Group. Would you like more information on Investment Advisory, Portfolio Services, and VC? Schedule a meeting with us here.

  • Will The Name Change of Square To Block Affects Its Share Price?

    After 6 years of Square being listed on the stock exchange, the CEO Jack Dorsey, who owns 24.4% of the company, changes its name to Block. The main reason for changing the name is for expansion as the company intends to focus on new technologies such as blockchain. Before now, Square was known for digital payments with a focus on point-of-sale terminals and auxiliary equipment to process debit cards. Since its IPO in 2015 at $9, the share price has done 31X as it reached an all-time high in August 2021 at $289.05.

    The lowest price of $SQ during the lockdown was $38.02. As the lockdown eased up, price appreciated above $200 before the end of last year. The price movement of $SQ in the last 11 months has been between $192.15 and $289.05. The range in the weekly and monthly chart has been broken to the downside this week as the price reached $185.72. $SQ is currently not showing an indication of a price reversal to the upside. Since the day Square has been changed to Block, the price of $SQ has gone south.

    Some of these ideas are in our clients’ portfolios. To understand which ones can work for you or for help to invest for your own wealth, talk to our advisors at FM Capital Group. Would you like more information on Investment Advisory, Portfolio Services, and VC? Schedule a meeting with us here.

  • Zoom’s Share Price Falls Further

    Zoom’s investors had a good return in 2020 after the price opened at $67.23 to reach an all-time high of $588.21, which is over 8X. During the lockdown, many meetings and conferences were held virtually as Zoom was the favorite of many organizations. However, 2021 is the worst year for $ZM investors since its IPO in 2019. The opening price for Zoom this year was $337.07. As offices began to open due to the mass vaccination of people in different countries across the globe, the price of Zoom began to fall. The hope that showed in July 2021 as a result of the monthly candlestick was dashed away when all gains were lost in August 2021.

    Daily chart

    The current share price of Zoom is at $218.79 which shows that Zoom investors have lost 35% from the opening price of this year. A breakout to the downside has occurred from the August 2020 support level at $233.23. Is this going to be a continuous downtrend? The next few weekly candlesticks will determine the next direction. The share price of Zoom is currently at the lowest since June 2020 at $211.41. There are tendencies that the share price of Zoom might rise to $400 as many countries begin to lock their borders due to the new cases of the Omicron variant of the coronavirus. As countries begin to lock borders, this might eventually affect the workspace. Companies might fall back to the remote ways which worked during the lockdown.

    Weekly chart

    Some of these ideas are in our clients’ portfolios. To understand which ones can work for you or for help to invest for your own wealth, talk to our advisors at FM Capital Group. Would you like more information on Investment Advisory, Portfolio Services, and VC? Schedule a meeting with us here.

  • Twitter Has Lost All Its 2021 Gains

    Twitter’s opening price at the beginning of 2021 was $54.22. Later in the first month of the year, the price fell to the lowest level in the year at $45.59. After the price fall to $45.59, the price rallied in February 2021 to reach an all-time high at $81.09. Since the all-time high was reached, prices began to go lower. There have been lower lows and lower highs, which has resulted in huge losses as all the $TWTR gains of 2021 have been lost. Twitter is currently at a -16% loss from the opening price of the year.

    Weekly Chart

    After Thanksgiving Day, the market opened at $46.54 and closed at $47.10. But on the 29th of November 2021, the price had a gap up from $51.84 which showed a bit of hope until Jack Dorsey announced his resignation as the CEO of Twitter. The share price of $TWTR closed at $45.78 yesterday after Parag Agrawal was announced as the new CEO of Twitter. Price is currently around the year’s support level at $45.59. RSI is currently at the oversold position even after the price is around the support level.

    Daily Chart

    The gap up at the opening of yesterday’s share price for Twitter made the price reach the upper region of the Bollinger Bands, but the price crossed lower to the lower region of the bands at the close of the market. There may be a call for the bulls as a new CEO is appointed. A few Indian-American CEOs have emerged as the CEOs of American Tech Companies, and their share prices have been doing excellently. As the Twitter bulls become more active, the price might reach $66 in the coming weeks.

    Some of these ideas are in our clients’ portfolios. To understand which ones can work for you or for help to invest for your own wealth, talk to our advisors at FM Capital Group. Would you like more information on Investment Advisory, Portfolio Services, and VC? Schedule a meeting with us here.

  • SPX Had A Price Correction

    S&P 500’s opening price in 2021 was $3699.90. Price has been appreciating leading to different all-time highs. The SPX has done so well with return for investors as each month since the beginning of this year, there have been new all-time highs reached. The latest all-time high was reached at $4,745.40. This week has been very bad for $SPX has the price fell to $4,594.61 from the weekly opening price of $4711.61. Many stocks’ prices fell during the week as a result of the new variant of coronavirus discovered in South Africa named ‘Omicron’. A few countries are back to a lockdown to avoid the spread of the various. Countries are beginning to restrict movement to and from South Africa. As of July 2021, there are four dominant variants of the Coronavirus.

    On the weekly chart, the $SPX closed this week with a bearish candlestick. Looking at the 2020 chart of $SPX, especially before the spike in the cases of Covid-19 globally, the then all-time high in February 2020 was at $3384.11, the price fell to $2210.48 in March 2020. Since the lockdown, the price has been appreciating as price doubled since the lockdown has been eased. The support level at the second half of this year is maintained at $4284.31. The weekly charts show the candlesticks are still in the upper region of the Bollinger bands despite RSI showing that the price has been overbought. The bulls are still very active despite the correction this week. The price of $SPX might appreciate in the next few weeks, which might lead to a new all-time high above $4,800.

    Some of these ideas are in our clients’ portfolios. To understand which ones can work for you or for help to invest for your own wealth, talk to our advisors at FM Capital Group. Would you like more information on Investment Advisory, Portfolio Services, and VC? Schedule a meeting with us here.

  • Boeing Maintains The Same Support Level

    Boeing has maintained the same support level at 205.15 since it broke out of the resistance level in November 2020. This breakout led to the price rally which reached $278.38 in March 2021. 2021 has maintained a strong resistance at $278.38. Price has failed to reach the resistance level since march, instead, the price has touched the support level at least three times. In this month of November, the price has broken the trendline to the upside, which could be an indication of a possible rally to the resistance level at $278.38. The breakout of the trendline lasted for a few trading days before the price dipped to $211.00, which is the current price of $BA.

    Before the dip in March 2020, which as a result of the pandemic, the price of $BA reached an all-time high at $447.17 in March 2019. After the all-time high, the price dipped to $89.22. The fall was the worst fall since $BA went public losing about 80% of its value. In March 2020 after the lockdown has been eased, and the airline industry began operation globally, the $BA share price begins to appreciate. The market closed yesterday at $211.00. The price of $BA could appreciate to $267.59 in the coming weeks as the holiday and vacation season resumes.

    Some of these ideas are in our clients’ portfolios. To understand which ones can work for you or for help to invest for your own wealth, talk to our advisors at FM Capital Group. Would you like more information on Investment Advisory, Portfolio Services, and VC? Schedule a meeting with us here.

  • The Next Bullish Run of Disney

    The Disney share price is one of few stocks that has lasted over 50years and still brings returns to its investors. There was a setback to the Disney price in December 2019 after the price reached a new all-time high then at $154.16. Disney lost about 50% of its share value between December 2019 and March 2020, which was a result of the pandemic, making it the worst price dip since its IPO. After lockdowns were eased across the world, price began to appreciate. The price appreciation broke out the then resistance level at $154.16 to a new all-time high at $203.12 in March 2021. Since the worst fall of Disney during the 2020 pandemic, $DIS has appreciated almost 2X of its return.

    In the last month of 2020, the price broke out of the resistance level at $154.16 which led to the price reaching the new all-time high at $203.12. Since the all-time high was reached, the $DIS share price has lost about 31% of its value. In this month alone, $DIS has lost about 15% of its value. Should investors be worried about the price fall? The recent price fall could not break out to the downside of the support level at $154.16. A possible correction around the support level might occur which might eventually push the price of $DIS to $175.72.

    Some of these ideas are in our clients’ portfolios. To understand which ones can work for you or for help to invest for your own wealth, talk to our advisors at FM Capital Group. Would you like more information on Investment Advisory, Portfolio Services, and VC? Schedule a meeting with us here.

  • Some Analysts Said ‘Bitcoin To The Moon’

    Despite several forecasts of BTC to reach $100,000 or $200,000, BTC has failed to reach $70,000 with the recent bull run. BTC reached an all-time high at $68,999 on November 10, 2021. Most times when Bitcoin dips, other cryptos follow the same direction. Bitcoin had a previous resistance in April 2021 at $64,898. After the April all-time high, the price dipped by more than half as the price reached $28,764.37. This year support level for BTC is at $28, 731. A breakout of the April resistance at $64,876 was reached in October, which pushed the price to the most recent all-time high.

    At two different times between September and October, the price of BTC using the RSI shows that price has been overbought. Price has crossed to the lower region of the Bollinger bands. El Salvador has adopted Bitcoin as a legal tender. Some other countries like Panama, Ukraine are in the race to adopt Bitcoin as a legal tender. In a situation where Bitcoin price drops below the price it was acquired, this might affect the economy of the countries as the purchasing power will be affected.

    There are indications that the price of BTC falls below $30,000. This might be a bad one for the El-Salvador economy as it will be below the price it was initially bought. A breakout to the downside of the support level at $55,851 might push the price to $29,000.

    Some of these ideas are in our clients’ portfolios. To understand which ones can work for you or for help to invest for your own wealth, talk to our advisors at FM Capital Group. Would you like more information on Investment Advisory, Portfolio Services, and VC? Schedule a meeting with us here.