fbpx

Coca Cola Share Price Remains Bullish

Coca Cola Share Price Remains Bullish
A gap down occurred mid February causing the price of Coca Cola to plunge. The plunge did technically complete the M sign. The M sign is a trading pattern which after completion leads to a reversal. Nevertheless, price of $KO has been able to maintain the support level at 44.58. And price, has since the plunge, began an upward movement. This movement is quite slow but the bulls are heavily taking charge of the $KO market.

Coca Cola Daily Chart

Ichimoku has refused to show a bullish signal to complement this uptrend. Price of $KO was able to close above the cloud which might indicate a continuation of the uptrend. RSI has been able to show an oversold position in the daily chart. Also, price of $KO has been able to cross to the upper region of the Bollinger bands. This might eventually make $KO share price to move just above 49.00 from its current 47.29.

The Yen About To Appreciate Against The American Dollar

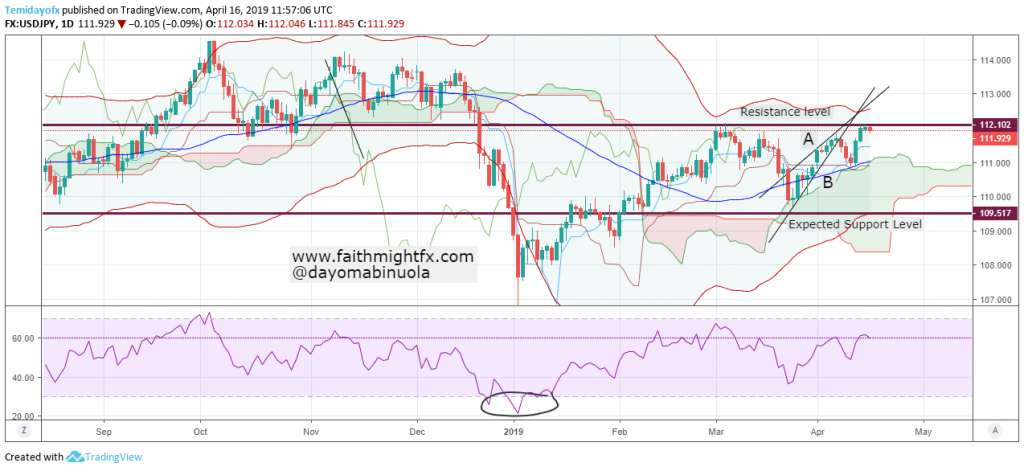
As the Yen is yearning for a rise in price against the US dollar, the US dollar was able to gain more than the Yen in the last one week. For the most part of 2019, the American dollar has gained about 4.914% against the Japanese yen, which signifies a bullish movement for the $USDJPY. Price of $USDJPY has failed to touch the upper line of the Bollinger bands despite the bullish movement. We have seen at two different instances that price of $USDJPY touched the resistance level line on the chart. Technically, it shows a double top, a strong indication of a reversal.

USDJPY Daily Chart

A doji has been formed after price touched the resistance level. Before the correction occurred on the 11th of April, price of $USDJPY touched the Bollinger band’s middle line. On the RSI chart, the price of $USDJPY did not show the overbought position on the daily chart. Also, the Ichimoku’s future still shows bullish strength, meaning the bulls are stil very much active. However, the trendlines have been broken to the downside on the 8th of April before a correction occurred. The expected support level is 109.517 from its current 111.932.

Bank Of America Failed To Break The Support Level

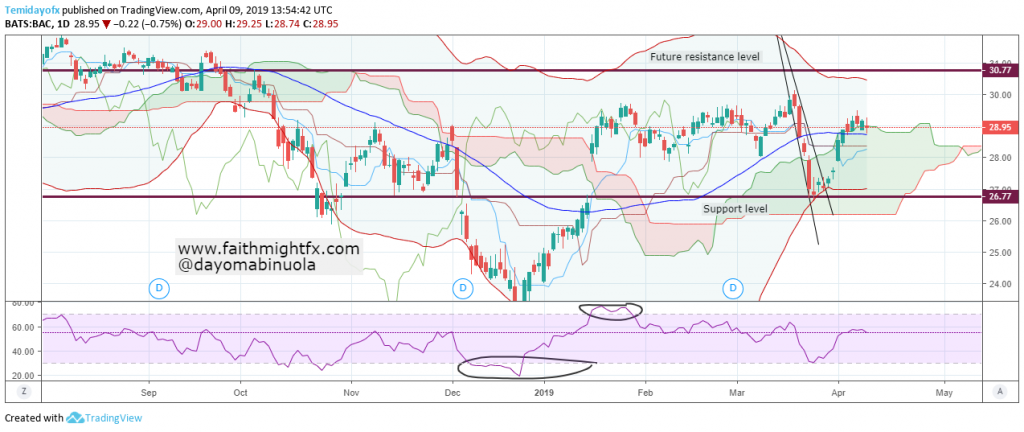
In December last year, Bank Of America share price was as low as 22.73. As the American market went down towards the end of 2018, $BAC also joined in the dip. After this dip, price rallied to the 26.77 level, which initiated to a strong support. There was a gap up on the 16th of January which made price to reach 29.64. After this gap up, a correction has occurred but the price of $BAC was not able to break the support level at 26.77.

Bank OF America Daily Chart


The correction after the gap up made price to cross to the lower region of the Bollinger bands. The trendlines have been broken and indications show a bullish takeover begins. Though we expect the $BAC bulls in the market, Ichimoku has not shown a bullish signal but showed a bearish signal instead. On the daily chart, price of $BAC is overbought. Price being overbought might be deceptive for the bears to get into the market. Currently, price of $BAC has been able to cross to the upper region of the bands. So price of $BAC could reach the next resistance level at 30.77 from its current 28.95.

Canadian Dollar Might Gain Against The American Dollar

A major breakout occurred from the bullish trend between October 2018 and January 2019. After this breakout, the price of $USDCAD has been ranging on the daily time frame. At the beginning of 2019, the $USDCAD began a bearish movement. This bearish takeover lasted until the first trading week of March before price crossed over to the upper region of the Bollinger bands. On the 19th and 20th of March, price of $USDCAD touched the Bollinger band middle line from the upper region which is an indication for a reversal.

USDCAD Daily Chart

Since December 2018, RSI has indicated the overbought position has been reached. The future of Ichimoku still shows the bullish strength is still active though price is yet to cross to the lower region of the bands. Price of $USDCAD could reach 1.30445 from its current 1.33586. The battle between the $USDCAD bulls and bears in 2019 has been a tough one after price reached the overbought position in 2018. Price of $USDCAD might begin a bearish movement soon and a breakout of the expected support level might push price further downward.

Boeing Has Lost Its Bullish Strength

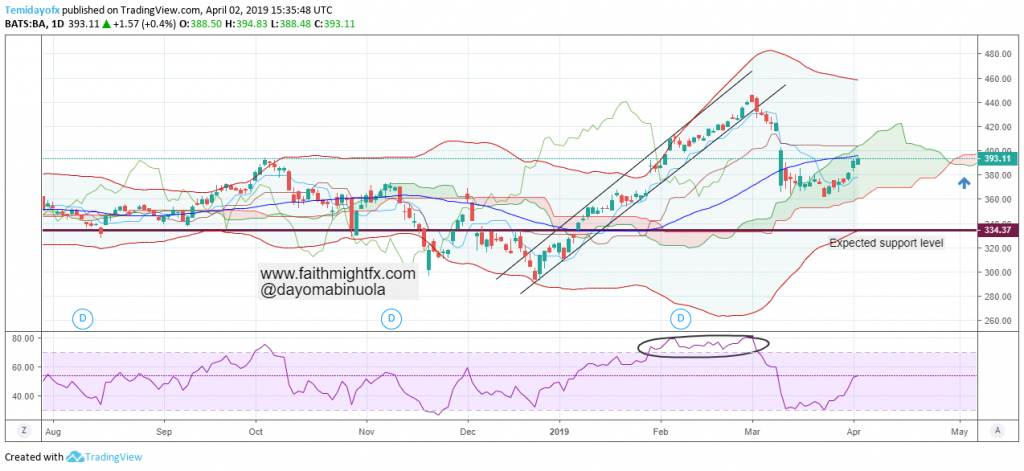
The share of price of Boeing fell after two Boeing planes crashed in the past few months. In 2019, Boeing has been bullish from 315.80 and reached an all time high this year at 447.12. A gap up that occurred in the last few days of January has been filled in March. The price of $BA has been on the upper region of the Bollinger bands throughout the year until mid-month of March. The volatility of $BA in 2018 was quite low until this year.

Throughout February, the price of $BA was overbought on the RSI. The future of Ichimoku has already shown a trace of downtrend. With the analysis using the trendlines, price of $BA could begin to fall from its current 393.26 to 333.71. The price of $BA has crossed to the lower region of the bands. If price of $BA breaks to the downside to reach the expected support level of 333.71, a breakout of the support level could make the price of $BA to continue to move downward.

Mastercard Is Currently Overbought

Mastercard is currently overbought after reaching an all time high for the stock. The new resistance level is at 235.66. The year 2019 has started on a bullish trend from 185.42 to the resistance level of 235.66. The overbought position for $MA was reached first at the beginning of February 2019. Since this time, price has continued to rally in the overbought region which could lead to a reversal on the daily chart.

Ichimoku is currently showing the bulls are in charge of the $MA market. RSI also shows price has been overbought for over a month. As we expect a bearish trend, price of $MA might go below 200. Price is yet to cross to the lower side of the Bollinger bands. A breakout has occurred from the trendlines but price is still in a range. Before the end of April, the bearish trend might become more dominant.

EBAY Share Price In Range, Might Go Bearish


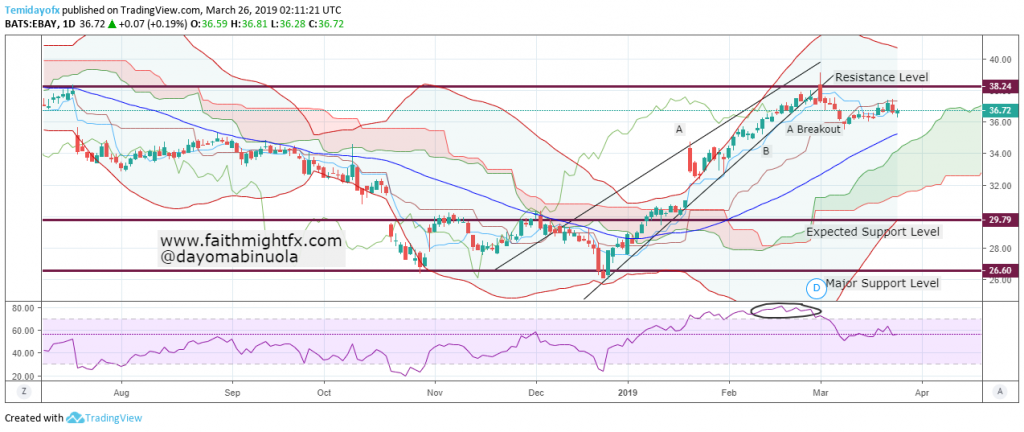
Price of $EBAY has reached the overbought position since January and it is yet to reverse. There was a gap up in January, in which the price is yet to fill up or retrace. $EBAY reached the resistance level at 38.43 on the first trading day of March. Since, $EBAY has been overbought for 2months.

A fall in the price of $EBAY is expected because of the continuous movement of price in the overbought region. As more bears could enter the market, the share of $EBAY might reach 29.79 from 36.72, which could serve as the new support level. The Ichimoku still shows the bulls are aggressively in power but the bears, in the long run, could overpower the efforts of the bulls. RSI undoubtedly is overbought after which a breakdown from the trendlines has occurred. As we await the bearish movement to gain momentum, the bulls might decide to enter the market after finding support at 29.79.

Hewlett Packard Price in Range, Might Go Bullish


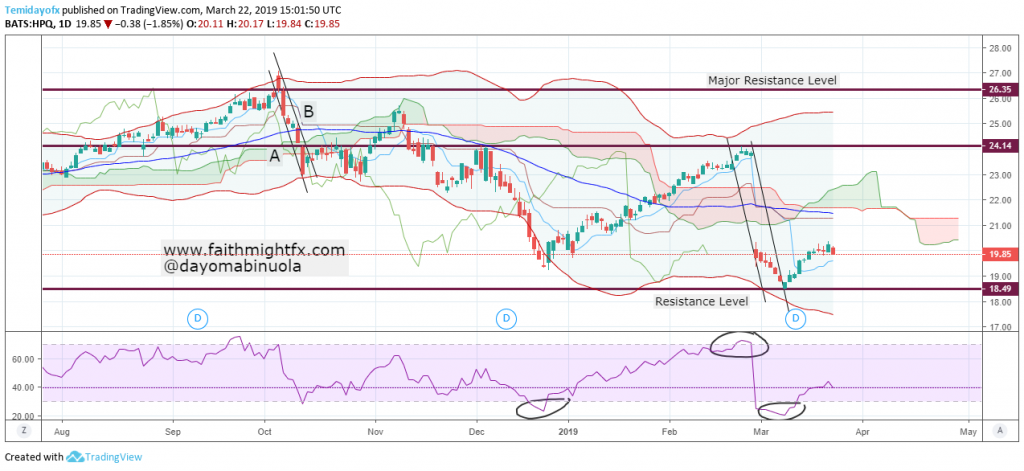
The year 2019 started on a good note for the $HPQ bulls when price moved from 20.20 on the first trading day to 24.14 on the 26th of February. Ever since the recent high was reached at 27.70 in 2018, price has ceased to reach that level again. Nevertheless, the price of $HPQ continues to maintain the support level at 19.45. On the 27th day of February, there was a gap down to 18.49 from the resistance level.

RSI shows that before the gap down, price of $HPQ had been overbought. The gap down made the RSI to reach the oversold region and since then, price remains in the lower region of the Bollinger bands. Ichimoku’s future still shows a bearish trend still active.

Facebook Share Price To Fall

On the 25th of January, we released an article stating Facebook bears are getting out of the market. At this point, our expectation for $FB share price to reach 160 has been met, which could pave way for the bears to resume trading. A breakdown from the trendlines A and B occurred in the last two trading days of last week. A double bounce in price touched the resistance level at 174.14 in the last 2 months, technically indicating a possibility for a reversal.

On the 31st of January, there was a jump in the price of $FB from 150.61 to 165.36. Ever since the jump occurred, a range in price resumed. Price of $FB is beginning to touch the middle Bollinger band line, which might likely indicate a weak bullish trend. Though the future of Ichimoku shows no reversal, price of $FB might begin to fall. A fall in price might make the $FB shares to drop to 139.06. Taking a further look at the RSI, price of $FB has been overbought, preparing for a reversal.

Dollar To Lose Bullish Strength To Swiss Franc

Since the beginning of 2019, $USDCHF pair has maintained a bullish trend in price movement. $USDCHF has not been able to break the resistance level 1.01238 for awhile. The Swiss Franc has technically shown a double top which might result into a downtrend. The $USDCHF tried to touch the middle line Bollinger band before a correction occurred as a fall in price of $USDCHF is due.

The Ichimoku’s future still shows the bulls currently dominate. As we expect a reversal due to the breakout from the trendlines, price could touch the support level at 0.97369. RSI has not shown any trace of price being overbought. Last week, the $USDCHF was bullish. But this week, it has been the other way round. The Swiss Franc might gain about 400pips with the RSI indicating more $USDCHF bears entering the market.