fbpx

Unilever Might Lose Major Shareholders

Unilever has decided to relocate its headquarters to the Netherlands. $UL is a company co-owned by Magaine Unie, a Dutch Company, and Lever Brothers, a British Company. One of the reasons for relocating is to simplify its corporate structure. Amid this deliberation, it is required that 75% of the company’s shareholders agree to this. Unilever is presently listed under FTSE 100 in London with a £124billion in market cap. Any relocation to the Netherlands, then $UL will cease to be listed under the FSTE 100. One of the major shareholders said it is not in support of the relocation; which will encourage long term investors to sell off their shares.

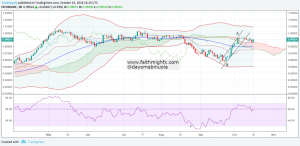
Meanwhile, price action has crossed over to the lower region of the bands. The Ichimoku shows the future movement of price trend to be downward. Price movement using the RSI also shows a continuous downtrend. I hope relocating the headquarter to the Netherlands will not lead to bigger problem for $UL as a company. Due to these indicators, sellers from the FTSE 100 might continue to sell off their $UL shares.

Source: Unilever Relocation Plan Rejected (BBC)

TESLA ON A SWING

Following the Smoking of Cannabis on a live show by Tesla CEO, Elon Musk, the share price of $TSLA dropped significantly. The Vice President of Worldwide Finance and Operation for Tesla , Justin McAnear, submitted a resignation letter recently after 3 years with the company. A bigger role came knocking at his door. Could he be leaving because of the instability of the $TSLA share price or because of the new job or he cannot fortell the actions of Elon Musk? About 30 executives have left the company since June. This is alarming for a publicly traded company like $TSLA. Investors might want to withdraw due to instability in executive leadership. Musk made a promise recently to increase production of the Model 3 sedan which might put the company on a profitable track. It is the most demanded amongst Tesla’s model of cars.

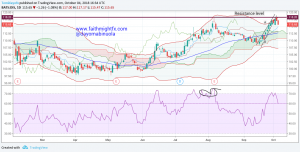
The trendlines A and B had an upward breakout already pushing to a new resistance level. Could $TSLA share be on the rise again? Hopefully an influential executive will not resign anytime soon and Elon Musk will not take another crazy action, which might in the long run decline the price of $TSLA. A doji already formed on the lower band for a change of trend. RSI on the daily chart shows an oversold market. As we look forward to the bulls taking charge of $TSLA, this might be in a range for awhile.

Sources: Elon Musk Cannabis Weed Smoking (INDEPENDENT.CO.UK)

Teslas Global Finance Head Leaving The Company (THE VERGE)

Apple Might Be Losing Its Bull Power

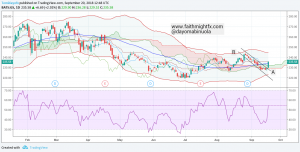
Apple shares reached a new high last month after its share price dropped heavily in 2014. $AAPL has unarguably maintained a bullish trend over the years. In August, $AAPL reached $1 trillion in market value, the first company in the U.S. to achieve that. President Trump recently started a trade war with China, which doesn’t seem to end soon. The trade wars are caused by his new trade tariffs.

For investors who have enjoyed the sweet ride of $AAPL in the past few years, they might book some profits. There will be lesser patronage when tariffs on Apple products from China is increased. Apple shares was down 1.3% on Monday after the news reports. RSI shows $AAPL has been overbought and might drop its value a bit depending on the conclusion on the trade wars. There is also a breakout downward from the two trendlines A and B. As at the time of this writing, the share price of $AAPL was at 219.43. It might continue the downward movement even below 210. The RSI has shown that the price of $AAPL has been overbought for days but a correction has started due to market sentiment around trade wars. Though the Ichimoku shows an upward trend, price might continue the bearish movement because it broke out of the trendlines.

Source: Apple Shares Fall (CNBC.com)

Pepsi Partners with NFL, A Challenge for the Bears

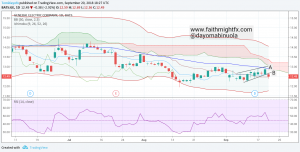
After several consolidations, it might be looking like a breakout upward for PEPSICO. For the last trading day last week, it was bullish and price closed above the line B. This could as a result of the program introduced by $PEP. It is called 360-degree program that brings football to their cities and into their homes like never before. $PEP partnership with the NFL kick starts this season( 2018-2019). While I drink more bottles of Pepsi, I hope to benefit from $PEP as the football season starts.

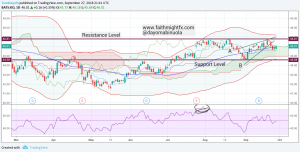
Though a cross from the middle line of bollinger band crossed over price but it could be a fake downtrend continuity. A trend between A and B has shown the price movement in the last few weeks. After the breakout, price might continue the bullish movement which started last week hoping to reach the new resistance level. $PEP might gain over 150pips in the coming days.

Source: Pepsi Unveils Football Program (NASDAQ)

Crude Oil Price Finds A New Resistance

Innovations coming up daily have brought about decline in demand for crude oil across the world generally. We are now entering the most active months of the hurricane season in the Atlantic Ocean. Even though weather scientists are forecasting that the 2018 hurricane season will not be nearly as active as 2017 and 2016, the Hurricane Gordon is forecasted to be heavy in October.

It has come to my understanding that not all hurricanes enter the Gulf of Mexico, but when they do, many oil companies will take precautions and shut down their offshore production and evacuate personnel before the hurricane hits. A trace of Hurricane Gordon, which came through the Gulf of Mexico on Tuesday and Wednesday, forced producers to shut down 9.23% of oil production in the Gulf and 9.06% of natural gas production from the northern Gulf of Mexico.

Over 45% of the total U.S. refining capacity is located in the Gulf. Hurricanes and other storms can cause flooding, sometimes severe, that has caused refineries to shut down. In 2017, the largest refinery in the United States, Saudi Aramco-owned Motiva, shut down for 2 weeks after Hurricane Harvey causing severe flooding in Port Arthur, Texas. Other refineries only closed for a few days during and after Hurricane Harvey.

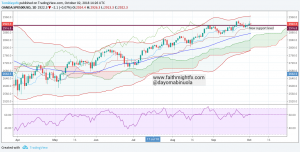
Meanwhile, there is already a breakout downward both with the RSI and Ichimoku. It is presently around $69 to a barrel and might find a new support at $65. For the most part of August, 2018, the price of crude oil was on the rise. Sellers might become active due to these indicators.

Sources: Hurricane storm threat (Investing.com)

Crude Oil Price Drops (CNBC.com)

THE EURO, READY FOR A COMEBACK

The $EURCHF has been on a downtrend since mid-July. The downtrend came to an end at the early part of August with over 500 pips movement. After the bearish movement, it consolidated, making the EUR gain against the CHF with over 200 pips. Later, the downtrend continued. A new support level was formed towards the end of August resulting to a double buttom on the 4hr chart. The RSI shows it is already oversold at two different instances in the last one month. $EURCHF might go bullish with about 200pips movement.

On the daily chart, using the RSI, a double bottom has been formed which complements other indications. Though the future of Ichimoku shows a continuous downtrend but price has rallied around the oversold section since the beginning of the week. A bullish trend in favour of the Euro might resume.

GBP Yearning For A Rise

The $GBPUSD obviously has been on a downtrend since April, 2018. A change of trend might occur soon due to some major decisions taken to favour the GBP. Most notably, small-business lending platform “Funding Circle” has officially announced its plan to raise GBP 300 million as part of its GBP 1.65 billion IPO on the London Stock Exchange.

As reported in January, Funding Circle was seeking advisors for the IPO. At that time, existing investors said the company could hit a GBP 2 billion valuation once it goes public. $GBPUSD using the RSI shows it has been oversold and might go upward soon. Price touched the resistance level last week and a breakout might occur which will lead to a bullish movement in favour of the GBP.

ONE EYE ON THE DOLLAR, THE OTHER ON THE FRANC

The US dollar has been losing to the Swiss Franc since the 20th of August, 2018. The Swissie might relinquish its strength to the greenback. On the 4hr chart using the RSI, there has been two obvious oversold spots. The last time price passed through the 2nd major support level was in the latter part of April, 2018. Price tried to maintain the support level 1 but continued the downward trend till a new support level was reached.

These indications might lead to a change of trend; though the ichimoku shows a continuous downward trend. Also, it shows on the 4hr chart that the candlesticks have been ranging for almost a day. An uptrend might resume soon in favour of the dollar. Investors might choose to go long on the USD majorly because its long due, ever since the first support level was breached. Price has also touched the edge of the Bollinger band and now on range, ready for a breakout on the opposite direction.

COULD FACEBOOK SHARES BE SINKING?

Facebook shares sank in the month following the Cambridge Analytica revelations, and they remain down more than 2 percent in 2018 against the S&P 500’s 7 percent climb.

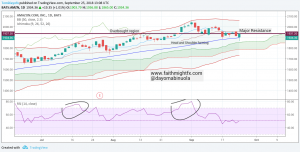
The stock was set to add to the year’s losses Wednesday morning, down 0.3 percent in pre-market trading. In the last one year, facebook shares has grown by 3.52%, In the last 3 months, it went down at an average of -6.61%; In the last 1 month, it went down by -1.49%; In the last 5 days, it went down, -0.61%. Facebook shares has been ranging ever since its share price dropped towards the end of the market day on the 25th of July, 2018. Its fall might continue since there are unresolved issues around the brand, Facebook.

The senkou span(purple colour) of the Ichimoku kinko Hyo shows the future of the market to be a downtrend or on a sell region. The RSI is above 70 which shows it is overbought for a long time and now in the sell region. It has not been oversold on the daily time frame. There are tendencies there will be more selling of the facebook shares.

MARKET OUTLOOK ON AUD/USD

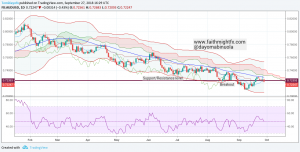
The Australian dollar had a resistance level at 0.7370. Ever since it touched this point, it has been on a downtrend. Could it be developing a new support level at 0.7288. On Friday, there will be high impact news to be released on the USD but for now this pair is in a range form. The Aussie has been losing to the dollar since Tuesday and might continue if the next news comes out in favour of the US dollar.

The AUD/USD with the RSI has been on the sell region for sometime but yet to be oversold  i.e. yet to get below 30%. The ichimoku kinko hyo (senkon span) has been in the sell region, which might still retain its stand.