Coinbase Global Inc. is an American publicly traded company that operates a cryptocurrency exchange platform. It is the largest cryptocurrency exchange in the United States by trading volume. The company was founded in 2012 by Brian Armstrong and Fred Ehrsam.
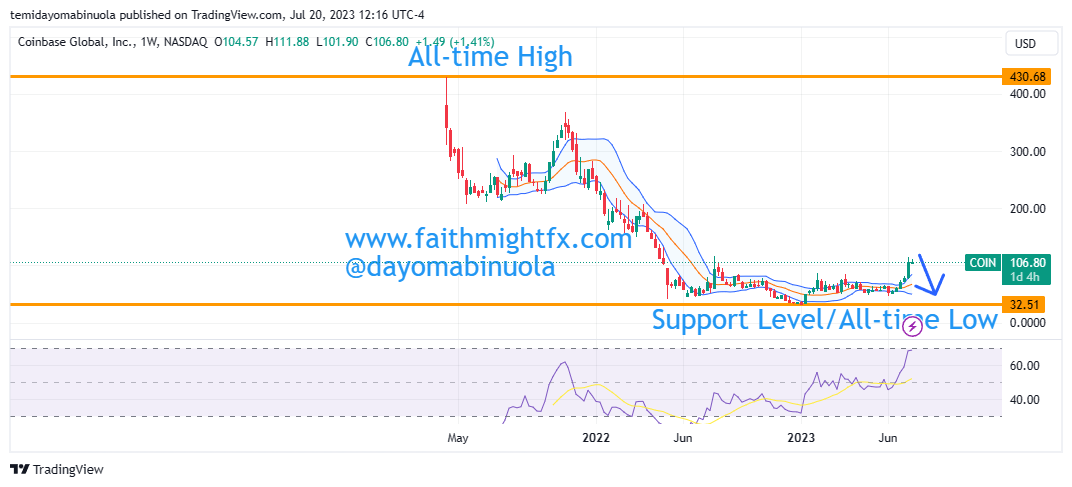
From the resistance level at $357.39 where it was on November 9, 2021, Coinbase stock fell to the all-time low at $32.53 on December 28, 2022. Since August 2022, $COIN has maintained a resistance level at $116. In the same August 2022, price fell below $100. For almost one year, price of $COIN has been trading below $100 up until the week of the 10th of July when price crossed the psychological level of $100 to the upside. The price is currently at $106.67 as of the time of this writing.
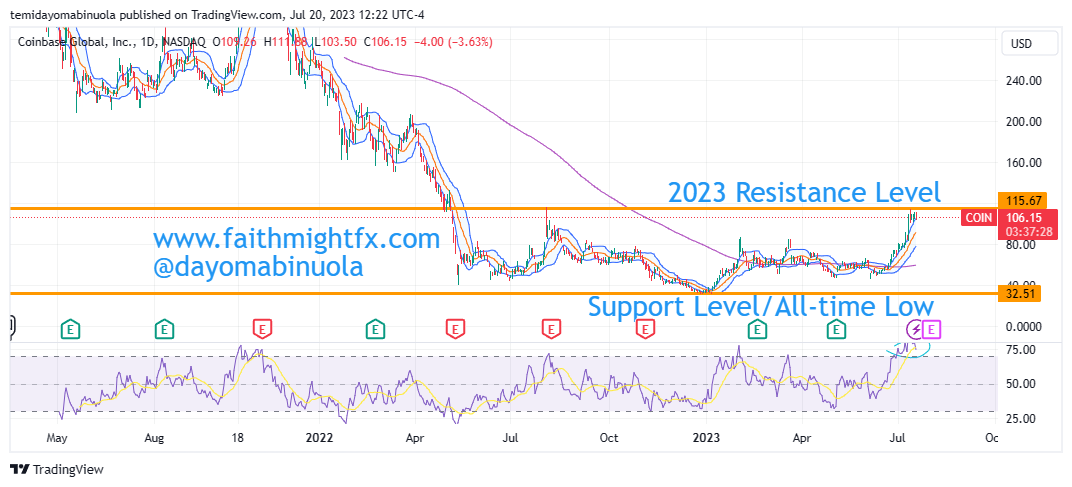
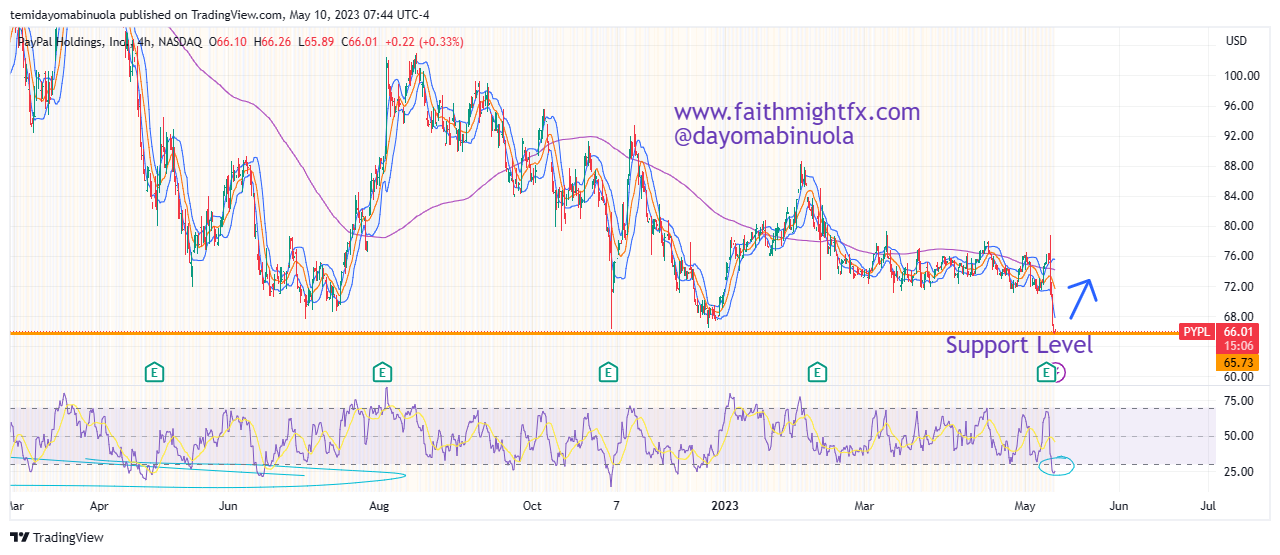
The bullish momentum might come to an end soon as the bears could push price to $40 in the coming weeks. RSI has shown us on the daily chart that price is overbought. This could be an indication of a possible price reversal.
Some of these ideas are in our clients’ portfolios. To understand if this one can work for you or for help to invest your own wealth, talk to our advisors at FM Capital Group. Would you like more information on how to get stock in your portfolio? Schedule a meeting with us here.