From the all-time of Tesla in November 2021 at $418 per share, the $TSLA share price has been falling in value. All investments made at the beginning of 2022 ended in negative figures due to the one year plus bearish trend. Despite the bearish trend in the market, Tesla made a revenue of US$81.46billion in 2022.
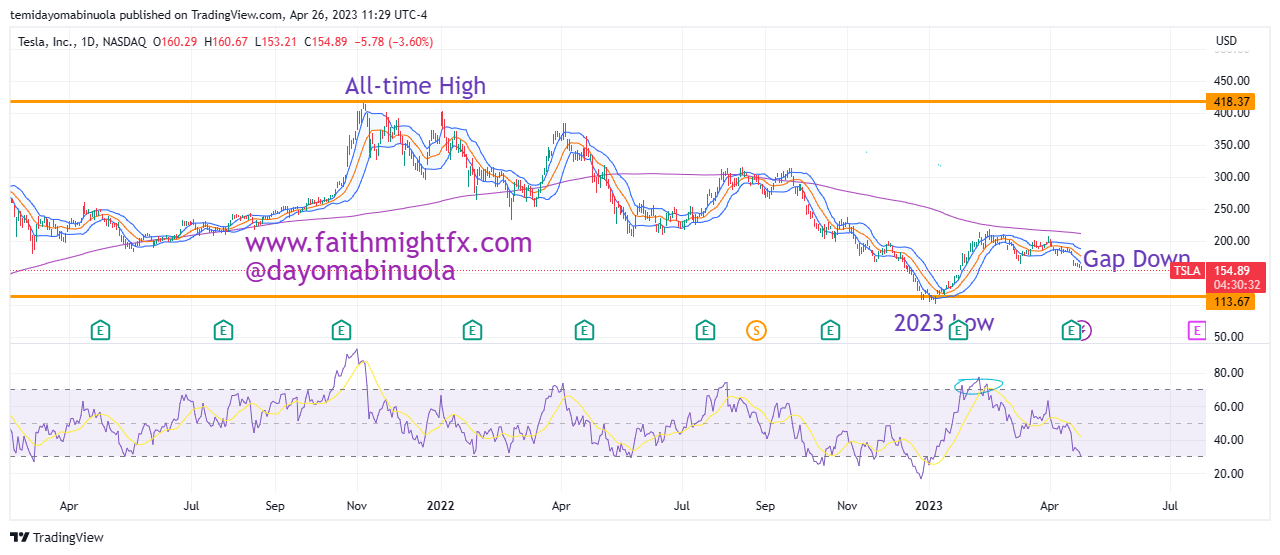
Despite the bearish trend of 2022, price of $TSLA was beginning to rally in 2023. with the price bouncing from the 2022 support level of $101 to the 2023 high of $218. In recent weeks the bears have pushed price to $155 and this could continue for some time.
On Thursday the 20th of April, 2023, the tesla share price opened with a gap down at $166. The lowest in the previous month was $164. The price on that Thursday closed at $163.04, a little bit lower that the March 2023 lowest price. Since the gap down, the bulls have failed to make a turnaround in the price as the price keeps falling.
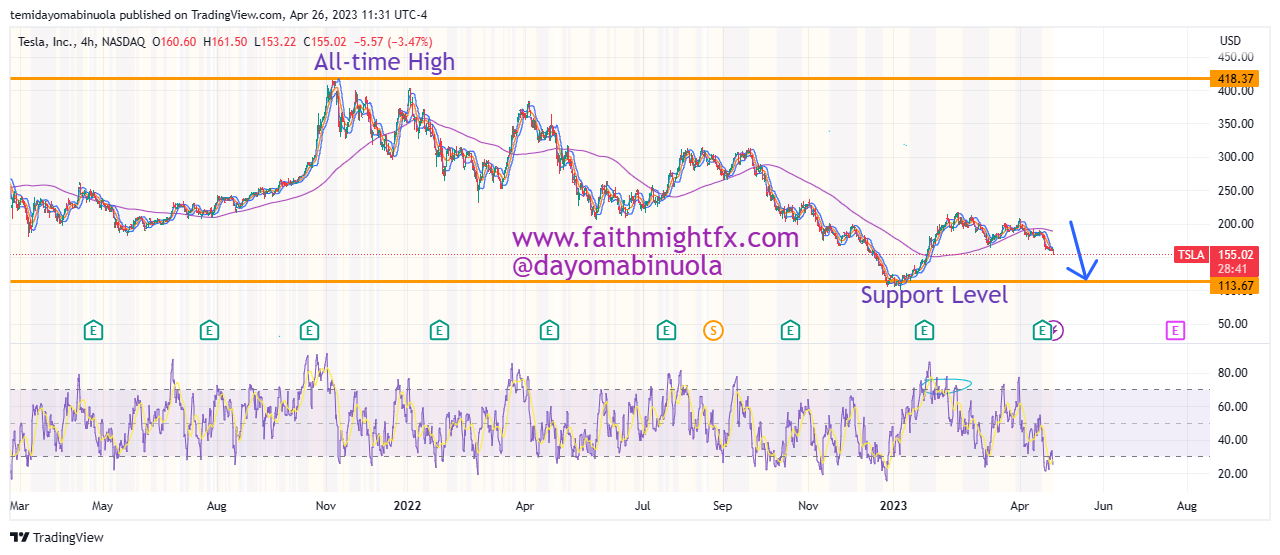
ON the 4hr chart, RSI showed that price had been overbought at two different times in March and currently shows that price has been oversold once in April. We might be falling to $113 in the coming weeks.
Some of these ideas are in our clients’ portfolios. To understand if this one can work for you or for help to invest your own wealth, talk to our advisors at FM Capital Group. Would you like more information on how to get stocks in your portfolio? Schedule a meeting with us here