Bitcoin has been in a range between $15,470 and $18,373 since November 2022. A breakout to the upside occurred on the 13th of January, 2023. Since the breakout, the pressure from the bulls have continued, causing January to end on a bullish note.
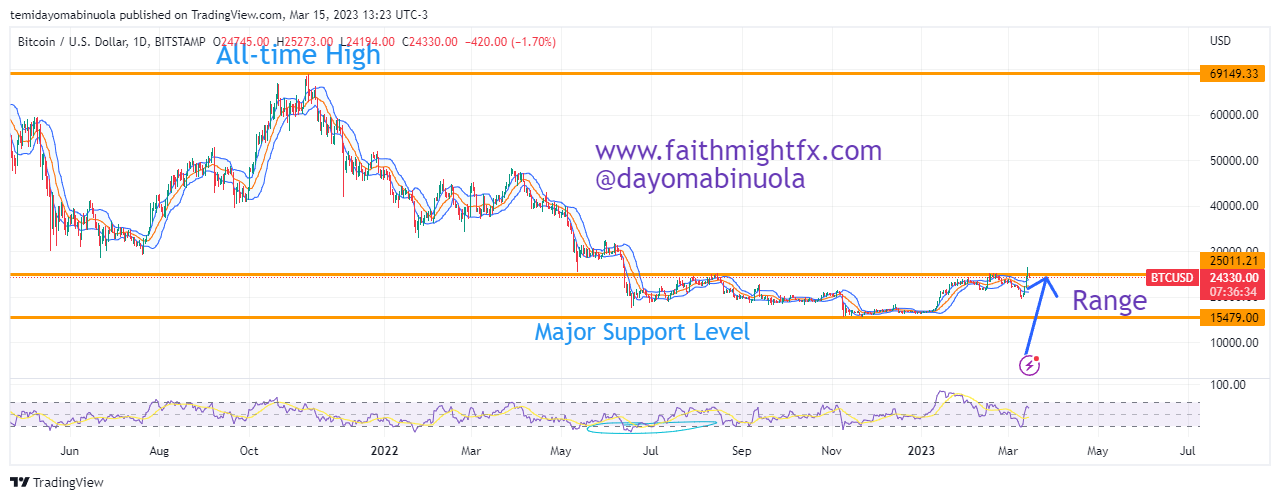
The bullish run continued in February and the price of Bitcoin hit a new high at $25,200. After this, the price fell to $19,560 but then the bulls took control again and price headed to $26,530. From a technical standpoint, the bulls are gathering momentum for a major bull run.
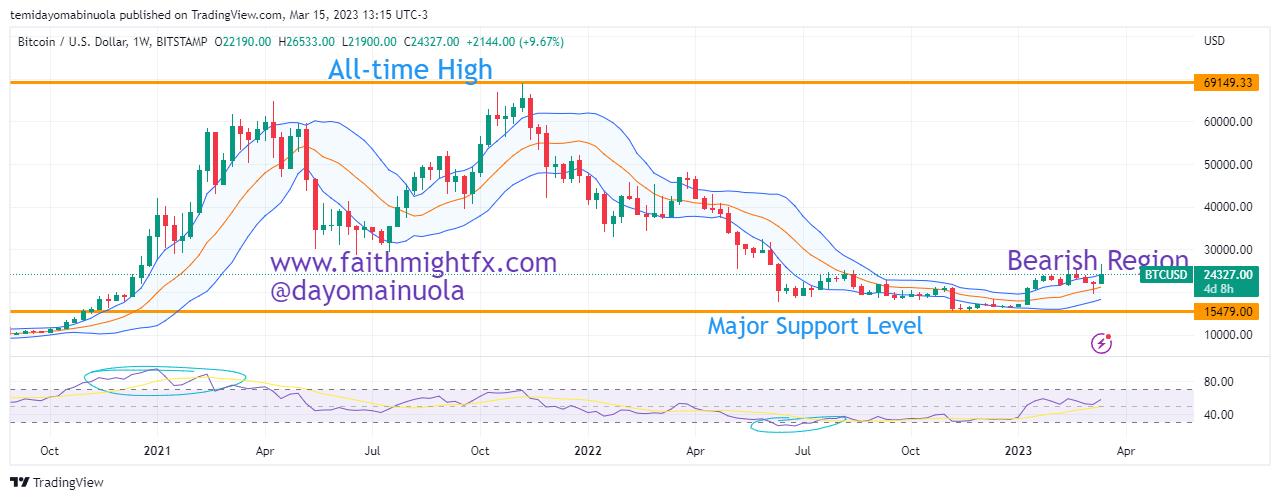
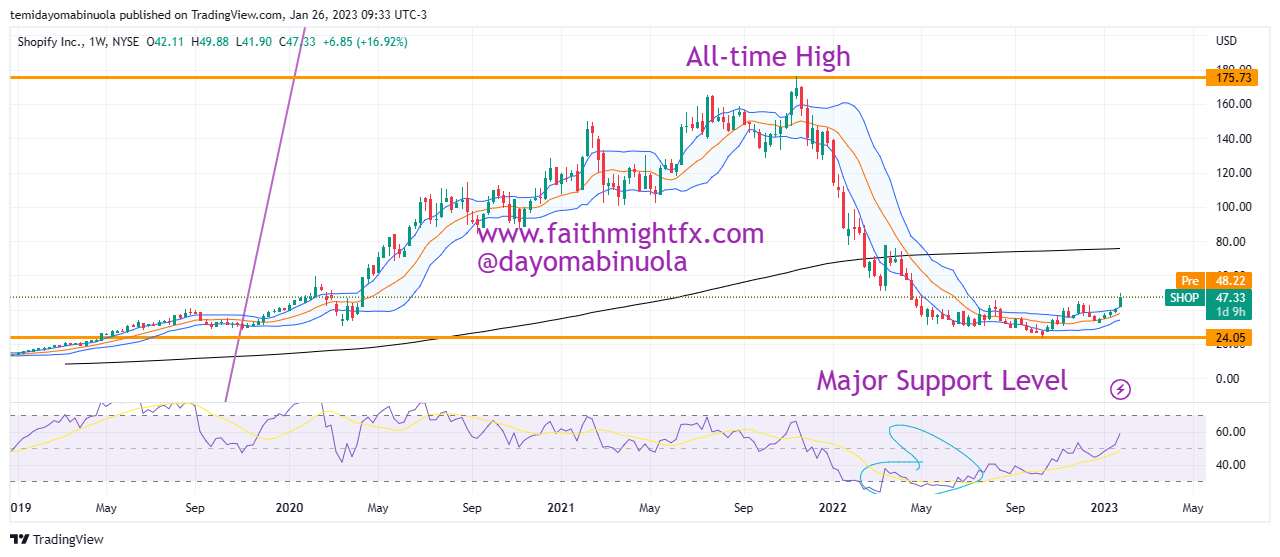
Looking at the RSI, price has been oversold since July 2022 on the weekly time frame. As of the time of publishing this article, Bitcoin is at $24,700. Our analysts forecast that in a few weeks, price will reach $30,000 psychological level.
Some of these ideas are in our clients’ portfolios. To understand if this one can work for you or for help to invest your own wealth, talk to our advisors at FM Capital Group. Would you like more information on how to get cryptos in your portfolio? Schedule a meeting with us here