Global economic activity is experiencing a broad-based and sharper-than-expected slowdown, with inflation higher than it’s ever been in several decades. The cost-of-living crisis, tightening financial conditions in most regions, Russia’s invasion of Ukraine, and the lingering COVID-19 pandemic all weigh heavily on the outlook. Global growth is forecasted to slow to 2.7 percent in 2023 from 3.2 percent in 2022. This is the weakest growth profile since 2001 except for the global financial crisis and the acute phase of the COVID-19 pandemic.
Taking a look at a few of the markets in 2023:
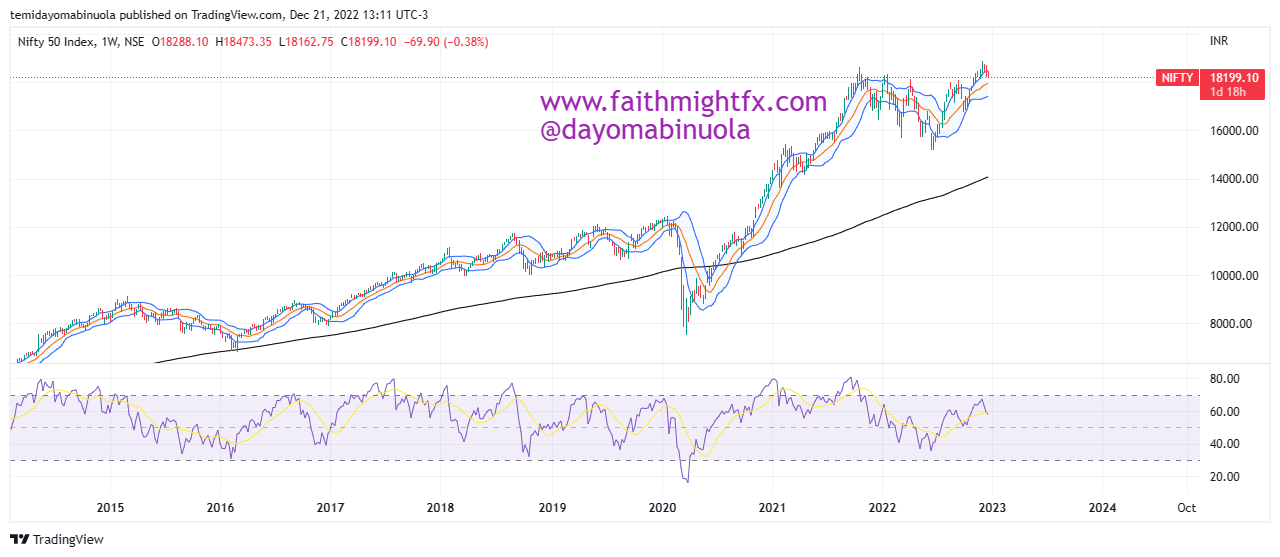
1. Nifty 50: This is a benchmark Indian stock market index that represents the weighted average of 50 of the largest Indian companies listed on India’s National Stock Exchange. Nifty 50 had a bounce from the lockdown lows in 2021. This appreciation continued in 2022 as price reached an all-time high at 18900 in the last week of November. The first half of 2022 was dominated by the bears until July when the bulls pushed price to a new all-time high. in 2023, we might see Nifty 50 below 15000.
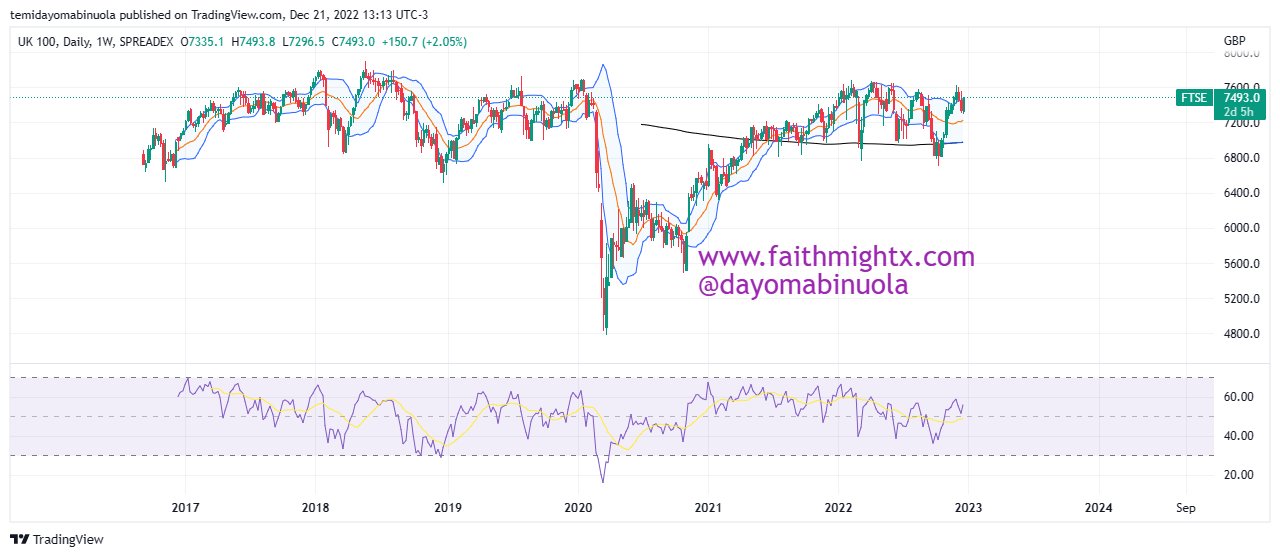
2. FTSE 100: This is a share index of the 100 companies listed on the London Stock Exchange with the highest market capitalisation. Just like Nifty 50, the FTSE 100 bounced from the pandemic lows. The FTSE 100 ranged between 7600 and 7682 in 2022. We might see a breakout of the resistance level of 7682 in 2023.
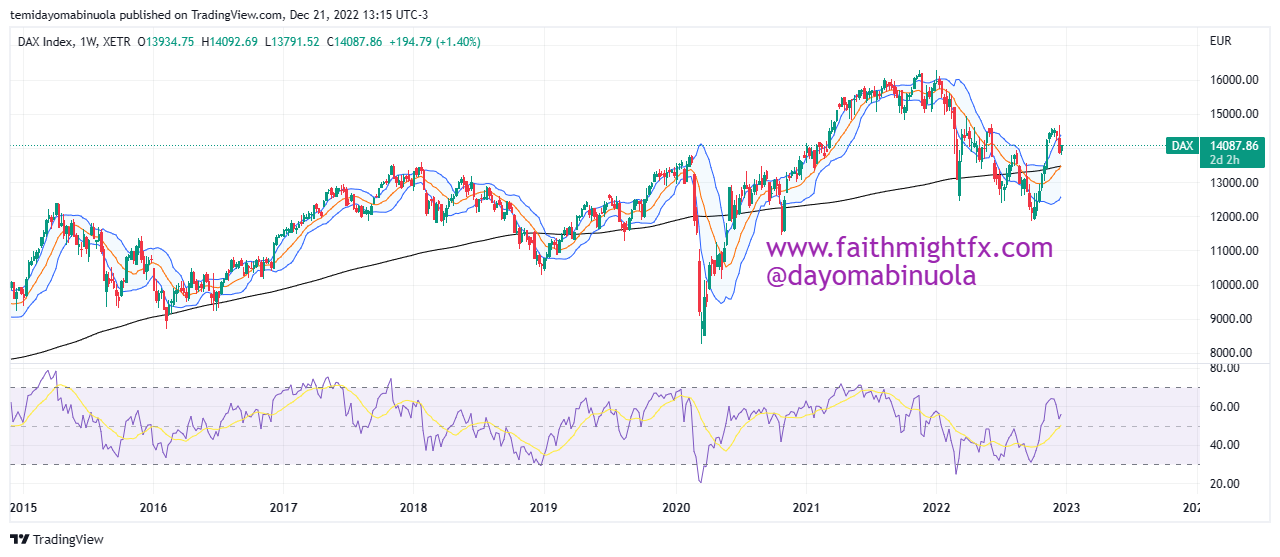
3. DAX: The DAX is a stock market index consisting of the 40 major German blue-chip companies trading on the Frankfurt Stock Exchange. The DAX rallied in 2021 from a 2022 low of 8288 to an all-time high at 16278. The first three quarters of 2022 were bearish until October as the bulls pushed the price of DAX upwards. The price of DAX could reach a new all-time high in 2023.
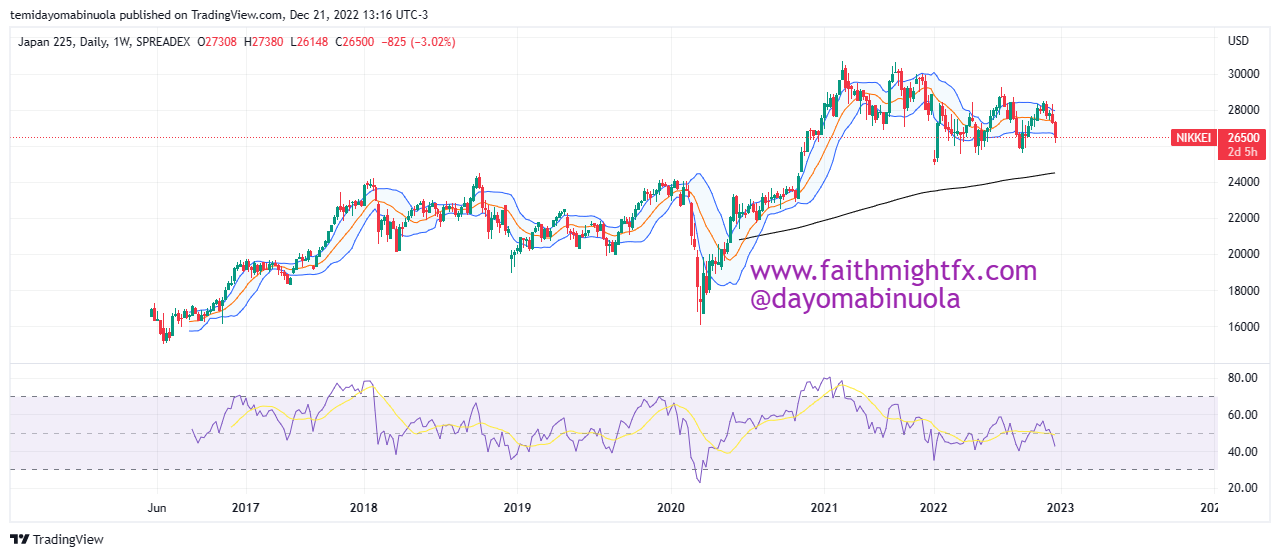
4. NIKKEI 225: The Nikkei 225 is the stock market index for the Tokyo Stock Exchange. The Nikkei measures the performance of 225 large and publicly owned companies in Japan from a wide array of industry sectors. The Nikkei 225 shows that it could reach a new all-time high in 2023. 2023 might just be a year to recover losses incurred in 2022 as a result of the activities of the bears.
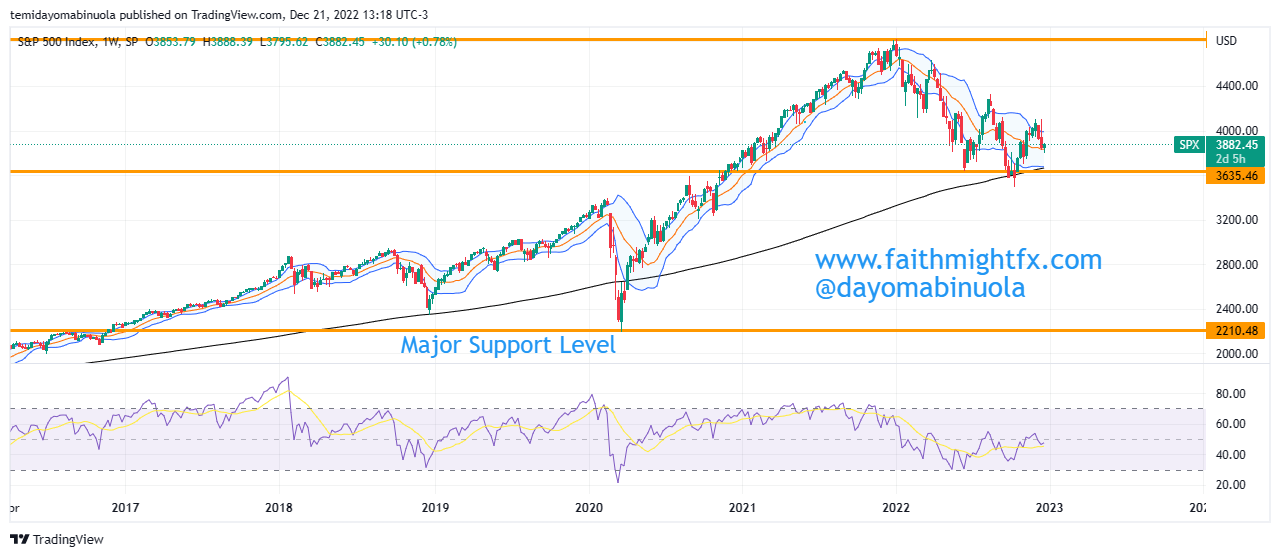
5. S&P 500: The S&P 500 is a stock market index tracking the performance of 500 large companies listed on the stock exchanges in the United States. The year 2021 ended as the SPX reached an all-time high at 4822. The year 2022 was not a good year for the SPX investors. The year 2023 could be a year of recovery and SPX could reach a new all-time high.
Some of these ideas are in our clients’ portfolios. To understand if this one can work for you or for help to invest your own wealth, talk to our advisors at FM Capital Group. Would you like more information on how to get stock indices your portfolio? Schedule a meeting with us here