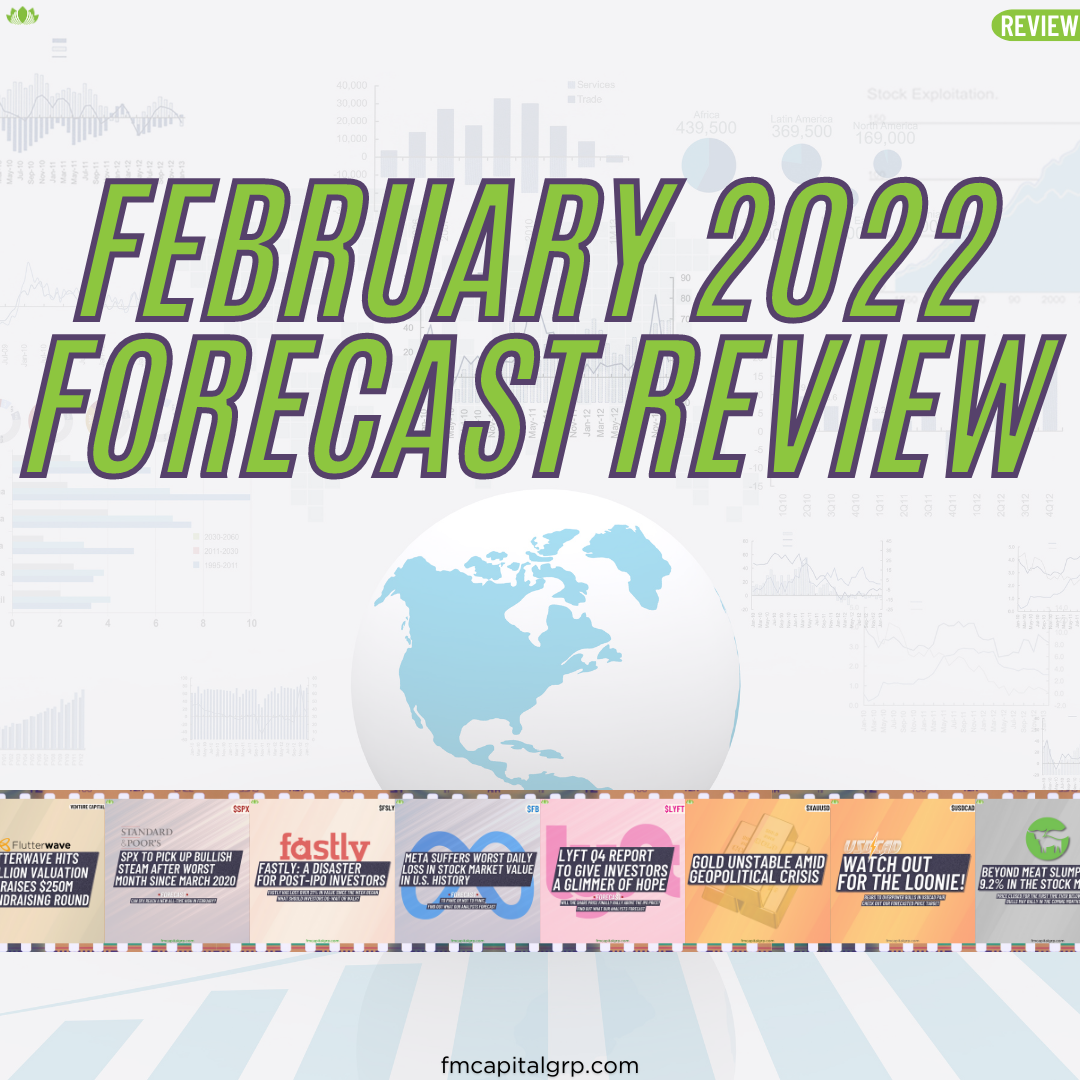
In this article, we will be reviewing our forecasts for the month of February 2022. Here we go.
On the 1st of February, we forecasted that stock market index SPX would rise to $4805.68. This forecast was a Miss as the index has been bearish. This bearish wave also made a strong impact on Meta and Lyft which we forecasted would both rally to $381 and $55 respectively. The two forecasts missed as well.
On the 14th of February, we forecasted that USDCAD would fall to 1.24754. This was a Hit! In that same week, we forecasted that cloud computing services provider, Fastly, would rally. Fastly share price eventually didn’t rally.
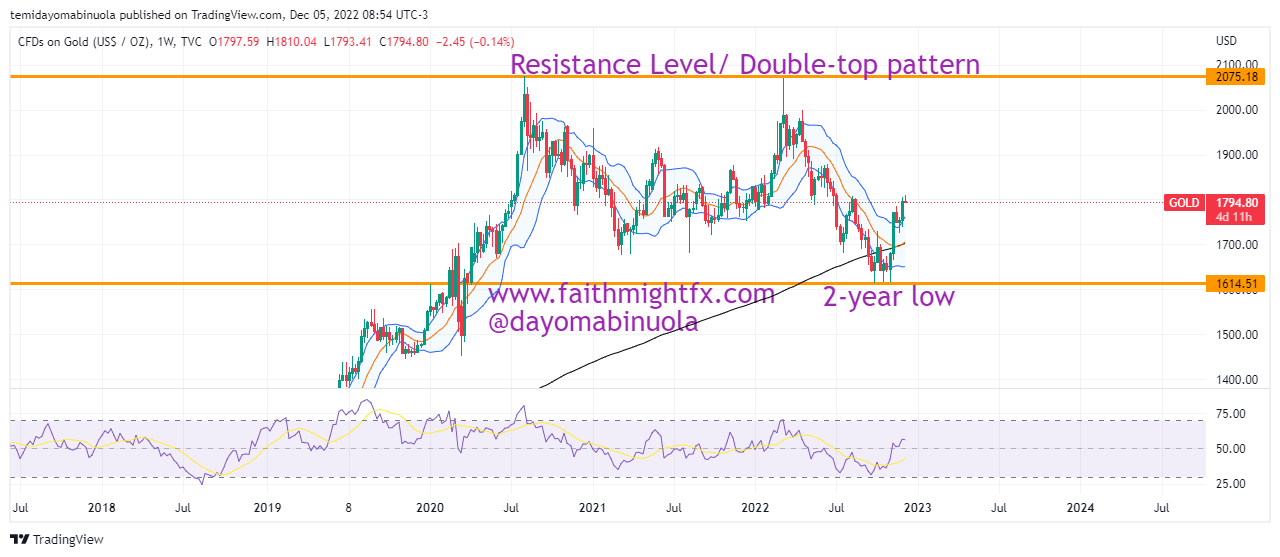
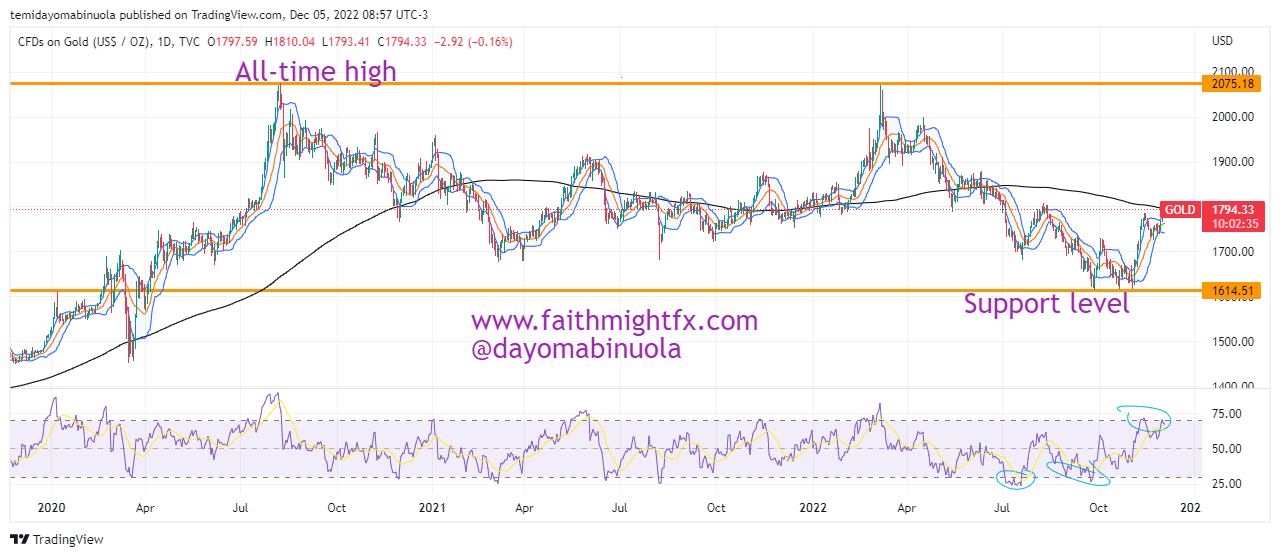
The following week on the 23rd of February, we forecasted that Gold would rally to $1912. On the 27th, we also forecasted that plant-based meat provider, Beyond Meat would rally to $154. Gold was a Hit but Beyond Meat didn’t hit the target.
Some of these ideas are in our clients’ portfolios. To understand if this one can work for you or for help to invest your own wealth, talk to our advisors at FM Capital Group. Would you like more information on how to get stocks in your portfolio? Schedule a meeting with us here