In the year 2000, EURUSD had its major support level at 0.82258. In July 2001, a rally began that lasted for years and this rally took EURUSD to an all-time high of 1.60932. This mark was reached in April 2008. Since this high, it’s been lower lows and lower highs for the EURUSD pair.

In September 2022, EURUSD reached 0.94990 which stands as a 19-year low for the currency pair. After this low, the pair saw a rally that bounced the price upwards to 1.04067 where it currently stands.
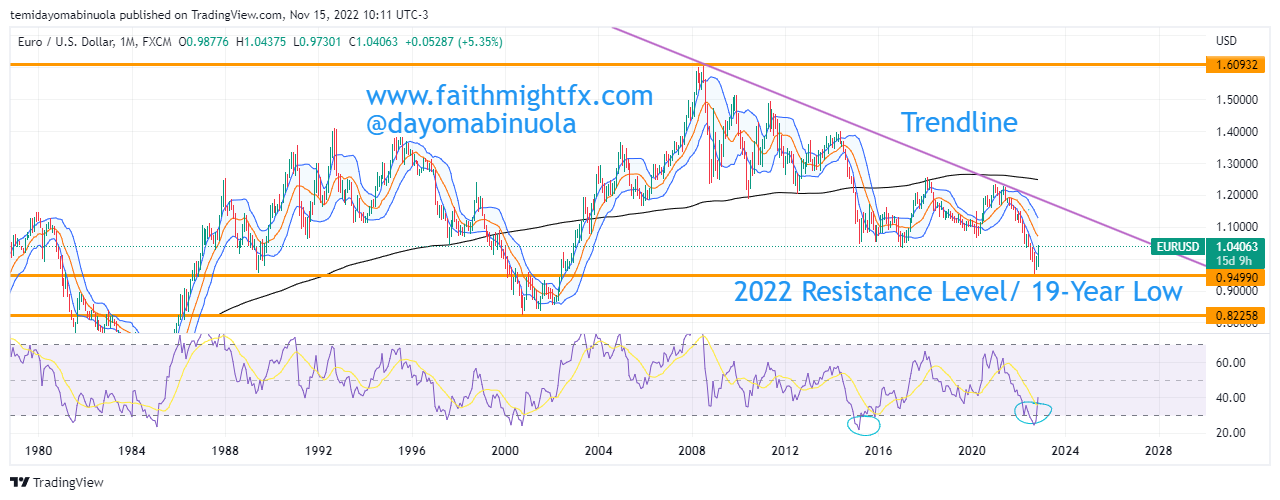
However, despite the current bull run, our analysts think that the bears are still in control and the US Dollar will still gain against the Euro. Our analysts forecast EURUSD falling below the 19-year low of 0.94990 in the coming weeks. Though we have RSI indicating that price has been oversold twice, in 2015 & in 2022, on the monthly chart, it is not certain that this indication will lead to a rally for the EURUSD.
Some of these ideas are in our clients’ portfolios. To understand if this one can work for you or for help to invest your own wealth, talk to our advisors at FM Capital Group. Would you like more information on how to get currencies in your portfolio? Schedule a meeting with us here