It’s been a busy year for us as at FM Capital Group. From an investment perspective, it has been our busiest year to date for our small team of investors. For the remainder of the year, I will highlight each of our 2021 investments and talk up the wonderful, important, and impactful work each of these companies are doing in Africa.
In April of this year, I traveled to Uganda to finally visit my portfolio company, Raintree Farms. Raintree is my first angel investment on the continent and actually my first proper vc investment. While I had met founder TMS Ruge plenty of times before, it would be my first time seeing the Farm. They say great founders know other great founders. Teddy is no exception. He is THE most connected founder in Uganda. He knows all the players, particularly the younger founders with startups solving big challenges in Uganda that have the potential to scale out to wider Africa. So it was Teddy that introduced me to Zachary Mugabi Haavaldsen, co-founder of Truesoil.
The establishment and security of land rights is critically important to the growth of an economy and wealth of its citizens. 70% of the world’s population lacks proof of land rights. This places individuals and families at risk of losing their homes and land property. More importantly, this discourages people from acquiring land for agriculture, construction, or investment. In Africa, the lack of and false documentation is a major challenge. False documentation creates overlapping rights which leads to legal conflicts between neighbors, tenants, landowners, and government. A complete lack of documentation makes it very difficult for heirs to inherit property or landlords to collect their rental income. Governments need modern systems to not only better track property rights but to also collect their own tax revenue as well.
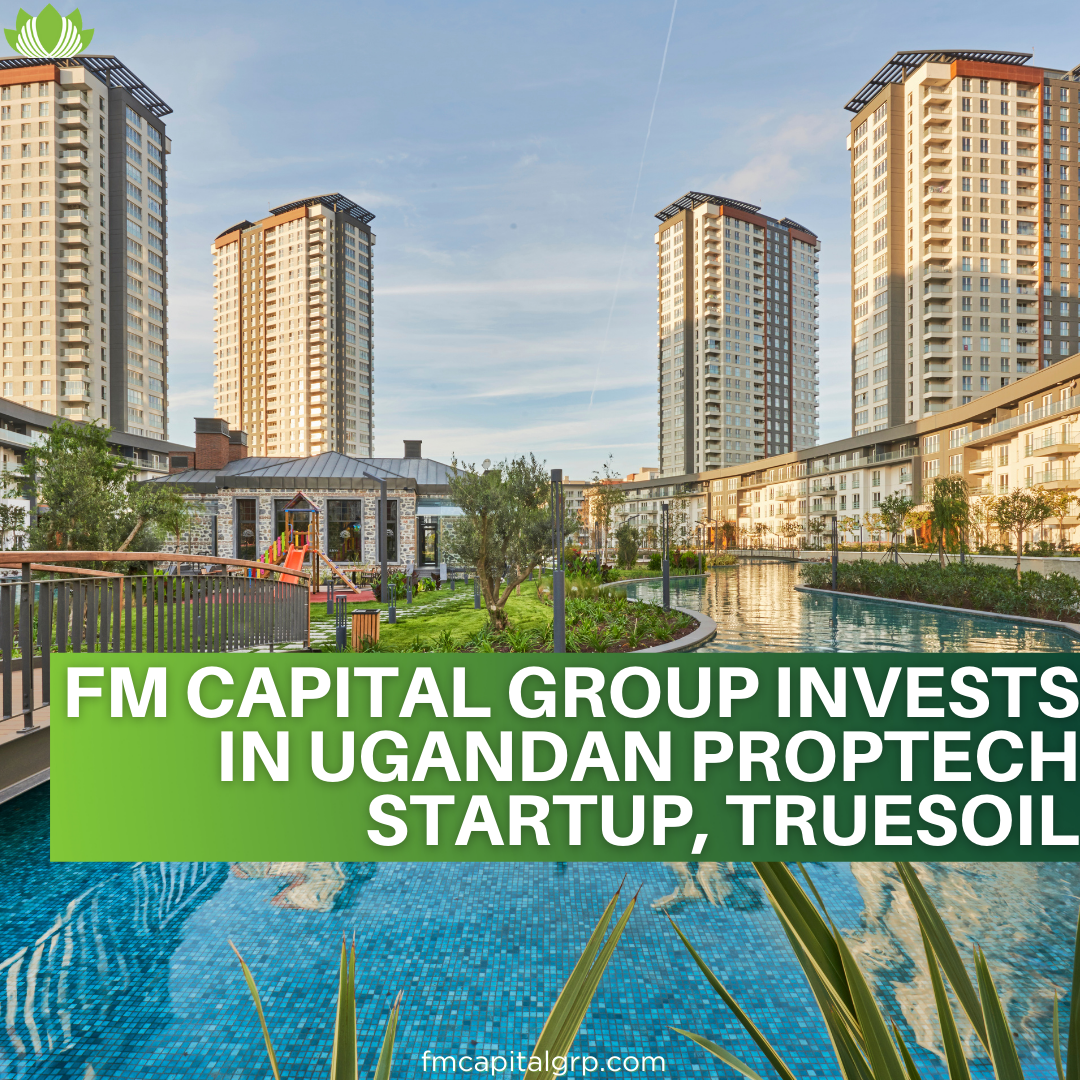
Enter Truesoil. Truesoil is a digital solution to help both tenants and property owners establish their land rights in African markets. The company is headquartered in Kampala, Uganda. We believe that Truesoil is well positioned to transform property management and real estate in Africa. And that’s why we invested in them. Gradually, Truesoil is changing the land ownership scene in Africa as it makes negotiations simple and personal, helps tenants and landowners reach balanced agreements by connecting them, and facilitates transactions in a transparent and traceable manner. Keep up the great work Truesoil team!
Follow Truesoil on Twitter, Facebook, and Instagram!
Some of these ideas are in our clients’ portfolios. To understand which ones can work for you or for help to invest for your own wealth, talk to our advisors at FM Capital Group. Would you like more information on Investment Advisory, Portfolio Services, and VC? Schedule a meeting with us here.