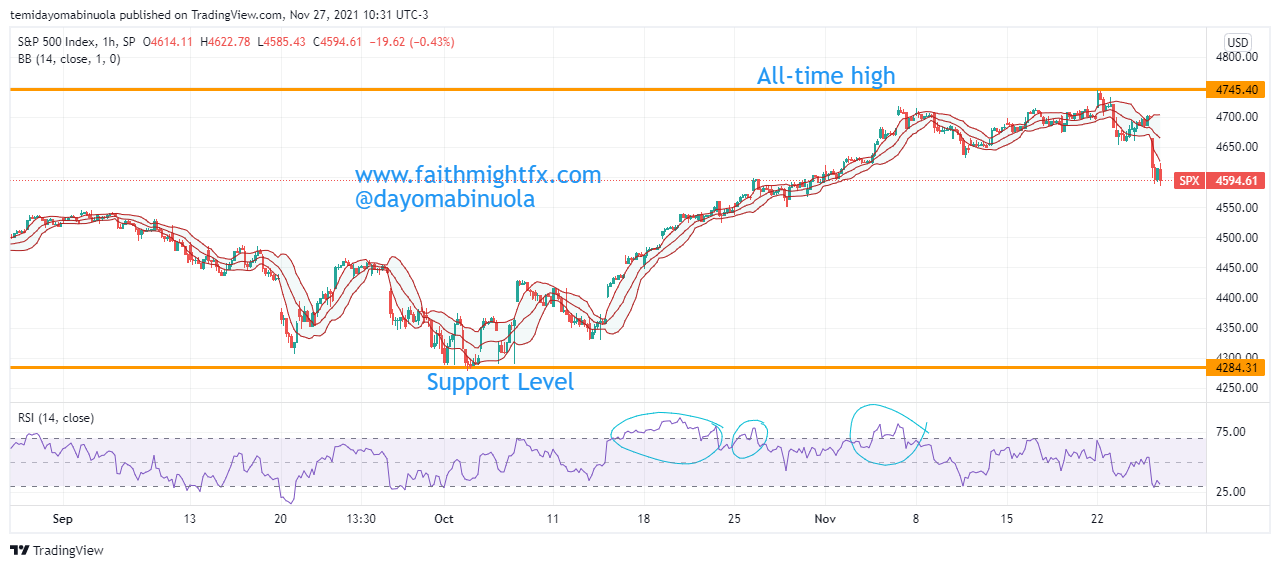
S&P 500’s opening price in 2021 was $3699.90. Price has been appreciating leading to different all-time highs. The SPX has done so well with return for investors as each month since the beginning of this year, there have been new all-time highs reached. The latest all-time high was reached at $4,745.40. This week has been very bad for $SPX has the price fell to $4,594.61 from the weekly opening price of $4711.61. Many stocks’ prices fell during the week as a result of the new variant of coronavirus discovered in South Africa named ‘Omicron’. A few countries are back to a lockdown to avoid the spread of the various. Countries are beginning to restrict movement to and from South Africa. As of July 2021, there are four dominant variants of the Coronavirus.
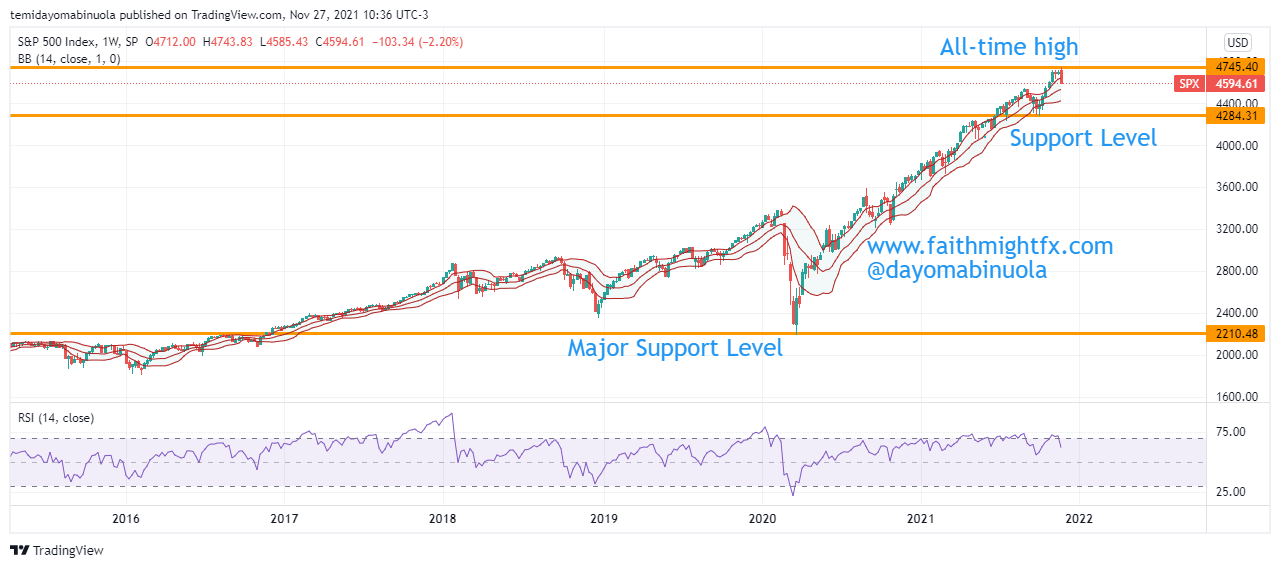
On the weekly chart, the $SPX closed this week with a bearish candlestick. Looking at the 2020 chart of $SPX, especially before the spike in the cases of Covid-19 globally, the then all-time high in February 2020 was at $3384.11, the price fell to $2210.48 in March 2020. Since the lockdown, the price has been appreciating as price doubled since the lockdown has been eased. The support level at the second half of this year is maintained at $4284.31. The weekly charts show the candlesticks are still in the upper region of the Bollinger bands despite RSI showing that the price has been overbought. The bulls are still very active despite the correction this week. The price of $SPX might appreciate in the next few weeks, which might lead to a new all-time high above $4,800.
Some of these ideas are in our clients’ portfolios. To understand which ones can work for you or for help to invest for your own wealth, talk to our advisors at FM Capital Group. Would you like more information on Investment Advisory, Portfolio Services, and VC? Schedule a meeting with us here.