fbpx

Dow Jones Might Plunge Further

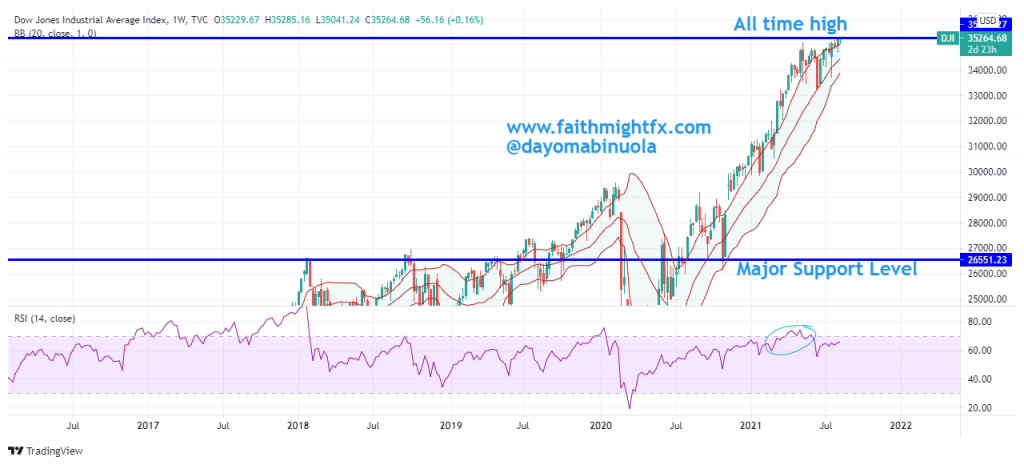
After a major dip to $18,900 occurred in the price of Dow Jones in March 2020. Price retraced to the resistance level at $29,500 in the same month. $DJI broke the resistance level at $29,500 in November 2020. Since this breakout occurred, $DJI has consistently reached a new all-time high every month. The recent all time high occurred this week at $35,100. $DJI’s price at the beginning of this year was at $30,200.  As at today, price of $DJI is at $34,000, which is about 11% gain in 2021.   

After the all-time high at $35,100 was reached this week, two bearish candlesticks were formed in the next days. These two candlesticks were as a result of the inflation data that was released on Wednesday. the $DJI plunged 680 points. Investors might have been fearful, hence the reason for the selling. Both S&P 500 and NASDAQ also took a nosedive. Could this be sign of the beginning of a bearish trend?

When a major dip occurred in March 2020, RSI showed price has been overbought. RSI is currently showing that p rice has been overbought. This could lead to a major dip in price. If this dip occurs, it might make price reach the support level at $26,550. If In the next few weeks, price might just be consolidating around $34,000. If the inflation situation worsens, price might plunge further.

Crude Oil Price At The Point Of Reversal

The global lockdown made price of Crude Oil fall to the negative region. The price of Crude Oil began to increase when a gradual ease of the lockdown began last year. The highest level crude oil price reached in 2021 was at 67.83. Before 2021, this level was reached in October 2018, which was a year before the coronavirus was declared a pandemic. Prior to the pandemic, the price of crude oil ranged between $42.73 and $66.76, until a dip occurred as a result of the lockdown. The current price of crude is at 61.00 as price has been ranging from 57.28 and 67.83 in the last few weeks. Few countries like Italy is back to lockdown due to spike in Covid-19 cases. Also, some cities in India are not left out. Hopes are currently being dashed due to increase in Covid-19 cases, despite vaccines are being administered across the world.
There are 4 instances of RSI showing price being overbought in the last two years. This year has been bullish with the $CL price, which opened at 47.15 to reach the highest level at $67.83. Towards the end of last month, price has been able to move to the lower region of the the Bollinger bands, which might be an indication of a reversal. If Covid-19 cases continue to rise across the world, the price of $CL might be lowered towards the support level at $35.85.

Gold Price Might Plunge Further

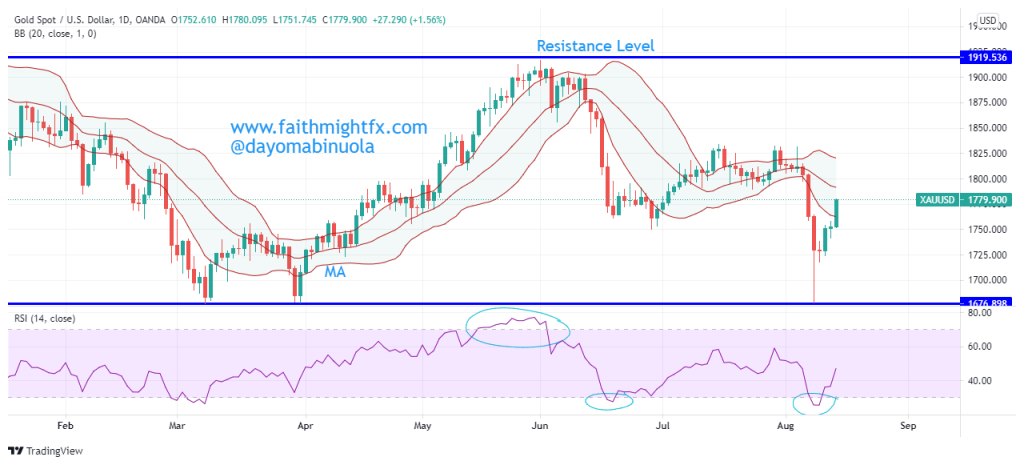
Gold price has been on a bullish run since 2018 with the lowest level at 1165 per ounce. Price reached the all time high of 2073.63 in August 2020. The year 2021 has not been a good year for gold Investors as price plunges. Each time price of $XAUUSD tries to rally since August 2020, it dips further. After $XAUUSD price maintained a bearish turn in the first-two weeks of April, price broke a resistance level at 1746 per ounce, the rally was extended to 1789. Despite a bearish turn since the beginning of this year, April is the first month with a reasonable gain in gold price with over 26.8% gain of the year losses.

Could it be that investors are worried despite the ease in the lockdown across the world? The trend since August 2020 shows that there have been lower highs and lower lows as a result of the plunge. Price of $XAUUSD could fall further. A reversal from the rally could make price plunge to the support level at 1740.536. There have  been a double top indicating a likelihood of a continuous dip. RSI shows price is currently overbought.

Tesla On A Downtrend

In July 2020, Tesla share price began a bullish movement from $322.61 to reach an all time high at $900 in January 2021. Price of $TSLA was in a range in January 2021 until the bearish movement started in the early trading days in February 2021. The dip from the all-time high at $900 brought price to $537.37 in March. A major support at $537.37 was reached due to the bearish movement. Not long after the price consolidation in March 2021, the $TSLA bulls started to push price higher, thereby creating higher lows and higher highs.

RSI indicates an overbought position on the 4hr time frame. Using the Trendline 1 and Trendline 2 for further analysis, price had to break the resistance level to the upside at $736.58 in Trendline 1, though the breakout could be a fake one. Trendline 2 is the support level after the dip which had support prices both at $539.57 and $600. The support level at $539.57 was the lowest price level $TSLA reached in 2021. Last week, there was an up-rise in the price of $TSLA, which made price of $TSLA to reach $780. There are other indications that could make the price of $TSLA fall to reach a new support level at $661.57. Buying $TSLA on a long term should be a good deal.

QUICK TAKE: EUR/GBP

There are times when markets just move so beautifully. Using the Fibonacci retracement and Fibonacci extension levels, we identified our entry point and our target and entered a short when price moved into the 38.2% Fibonacci level at 0.9116.

EURGBP 1-HOUR CHART

Starting the new trading week dropping from the 0.9230 highs of last week, the strong momentum evidenced in the RSI signaled to me that the strong rally had, indeed, ended. Instead of chasing the move lower, I took advantage of the correction higher when price bounced from 0.9045. With the risk clearly defined by the Fibonacci levels, I was comfortable with the short. Plus, the market seemed to believe that despite the hard negotiations the UK will get a favorable deal from Brexit.

Since then, the $EURGBP continued its descent towards the 123% Fibonacci extension level where I had my target. Price fell to that level before finding support this morning on the back of a economic double whammy of strong EU PMI data and weak UK CPI.

I wanted to show this trade as a learning example of how to read charts and use a few indicators to make good trading decisions. If you are interested in learning how to do fundamental analysis and find levels in your trading, please check out the CHARTS101 course. Read the charts for yourself so you can trade what you see and not what I think.

Read More:

  • Pound rises on reports of Brexit-deal progress (MarketWatch)

VC Is Just an Asset Class

Do you have venture capital in your portfolio? A lot of my work is getting investors to understand that venture capital is just another asset class. Because of the rock star status that venture capital-backed companies have and the multi-billion dollar deals that get all the headlines, many folks feel intimidated by the asset class. But it is simply investing. And it doesn’t have to require or involve billions of dollars to participate.

Honestly, if you have the risk tolerance to trade forex, you have the risk tolerance to invest in venture capital. Both asset classes run the risk of losing your entire investment. In fact, forex is probably MORE risky because the leverage required to trade in the forex markets can open up an investor to losing MORE than their principal investment. So you can actually lose more money than you started with when trading in the forex market. That’s not even possible in the private markets. And strangely, no one is scared of that possibility!

So if you are considering venture capital, the best opportunities lay in Africa and Latin America. There are a number of reasons why, which I won’t get into here. But if you are interested, I compiled a report, “Investing in The Global South”, to outline the opportunity in the region. You can reach out to me for a copy. While I have been investing in Africa for over 8 years, the opportunity is still early. And it is still even earlier in Latin America, which I have been actively sourcing for deals in the past 2 years. Which of the cities do you have in your portfolio?

Infographic of the top startup cities in Africa
Infographic of the top startup countries in Latin America
Click on article below to see the top cities in these countries

More reads:

  • INFOGRAPHIC: These are the best startup ecosystems in Africa (Techloy)
  • Top 10 tech hubs of Latin America in 2020 (Contxto)

SEC Allows More to Invest in Venture Capital

This August, the SEC finally came around to update its definition of an accredited investor. The old definition, while meant to protect small, individual investors, also locked many more folks out of venture capital and other alternative asset classes. These asset classes are also the most lucrative investments an investor can make. So when we talk about the wage gap, in any society quite frankly, the key differentiator is the ownership of business assets.

So I have been a huge advocate of individuals adding venture capital to their portfolio. Now I’m not advocating for blind investing. Never that. Even in the stock market, an investor should know why and what investment they are making with their money. But if you are, for example, a single individual with a net worth over $500,000, you can afford to consider even a single-digit allocation of your portfolio towards high risk, high reward alternatives.

No, the updated definition hardly opens up the floodgates for any ordinary investor. But it does allow more participation in the venture capital space, especially for people of color and young adults. And I believe that is a great thing for narrowing the wage gap. This policy change is a step in the right direction.

The new rule goes into effect this month. Find out if it makes sense for you and get invested!


We are here to help. Contact us.

ON THE AIR with The Trader’s Vibe

Last month, I had the pleasure of speaking with a new traders community. Led by Carl Burgette, The Trader’s Vibe is a new weekly video podcast series where Carl interviews notable and prominent traders every week. To be considered notable and prominent in this business is truly an honor so I was happy to join him on the show. As with any new community, we spent much of the time talking about my background and how I entered into finance (which is a very unorthodox path, to say the least). Of course, we talked markets and what I was seeing at that time in the GBP. However, this was the first time that I was asked about how I’ve been treated as a woman in the business and my thoughts on bringing more women and people of color into finance.

Catch my episode of The Trader’s Vibe below. Enjoy!


If you are interested in learning how to read and analyze stock & forex charts on your own, please check out the CHARTS101 course. Read the charts for yourself so you can trade what you see and not what I think.

QUICK TAKE: S&P 500

After the March 2020 crash, the $SPX staged an impressive rally (along with other US indicies) that took price to new all-time highs. After a shallow correction in September, the $SPX managed to stage another rally. However, this rally failed to take out the new August highs. This was the first signal that a move lower could possibly be in the works.

SPX 4 HOUR CHART

The 3400 level on the $SPX was former resistance marking the former highs in February of this year. So after the break to new highs in September, investors needed to see the 3400 level hold, now, as support. Each break below this level has seen price dip into the green zone of support between 3330-3350 with a move lower into the 3200 support level.

Yesterday’s weak close below the 3400 level was a second clue that lower prices were in store. The first signal was the failed high after price recovered back above 3400 the day before. Today’s gap lower at the open should move the $SPX to 3200. As we move into more uncertainty (as explained in yesterday’s analysis of $GBPUSD), this will be the level to watch. A move lower still will cause investors to panic and the Federal Reserve to act again.

Because of the monetary stimulus and central bank activity in markets right now, I honestly did not think markets would move lower. So it is nice to see this development today as I am a firm believer in natural market forces being allowed to prevail, no matter the pain. I know lol. So I welcome today’s price action. Price can move lower still and it would still only be a healthy correction of the past 6-month rally and move price into those Fib levels. That remains to be seen.


If you are interested in learning how to do fundamental analysis and find levels in your trading, please check out the CHARTS101 course. Read the charts for yourself so you can trade what you see and not what I think.

Quick Take: GBP/USD

After some initial volatility to start the new trading week, the $GBPUSD has found support around the 50% Fibonacci level of the rally over the past 2 weeks. U.S. dollar weakness is starting to take hold as the market looks at all of the uncertainty brooding for the U.S. Between the election, the lack of a 2nd covid relief bill and the subtle breakouts of a coronavirus second wave across the country, the market has started to dump the safe haven currency.

GBPUSD 4-hour chart

It is important to note that the 1.30 major support level is just below that 50% Fibonacci level. That level is lending some extra support to $GBPUSD bulls. If cable can continue to hold above these 2 levels, it looks like this rally continues higher towards 1.3250.

However, the event risk to consider for this pair this week includes the release of US GDP, US personal spending & personal income and US consumer confidence. And, of course, Brexit headlines continue to spook markets as unscheduled surprise events.


If you are interested in learning how to do fundamental analysis and find levels in your trading, please check out the CHARTS101 course. Read the charts for yourself so you can trade what you see and not what I think.