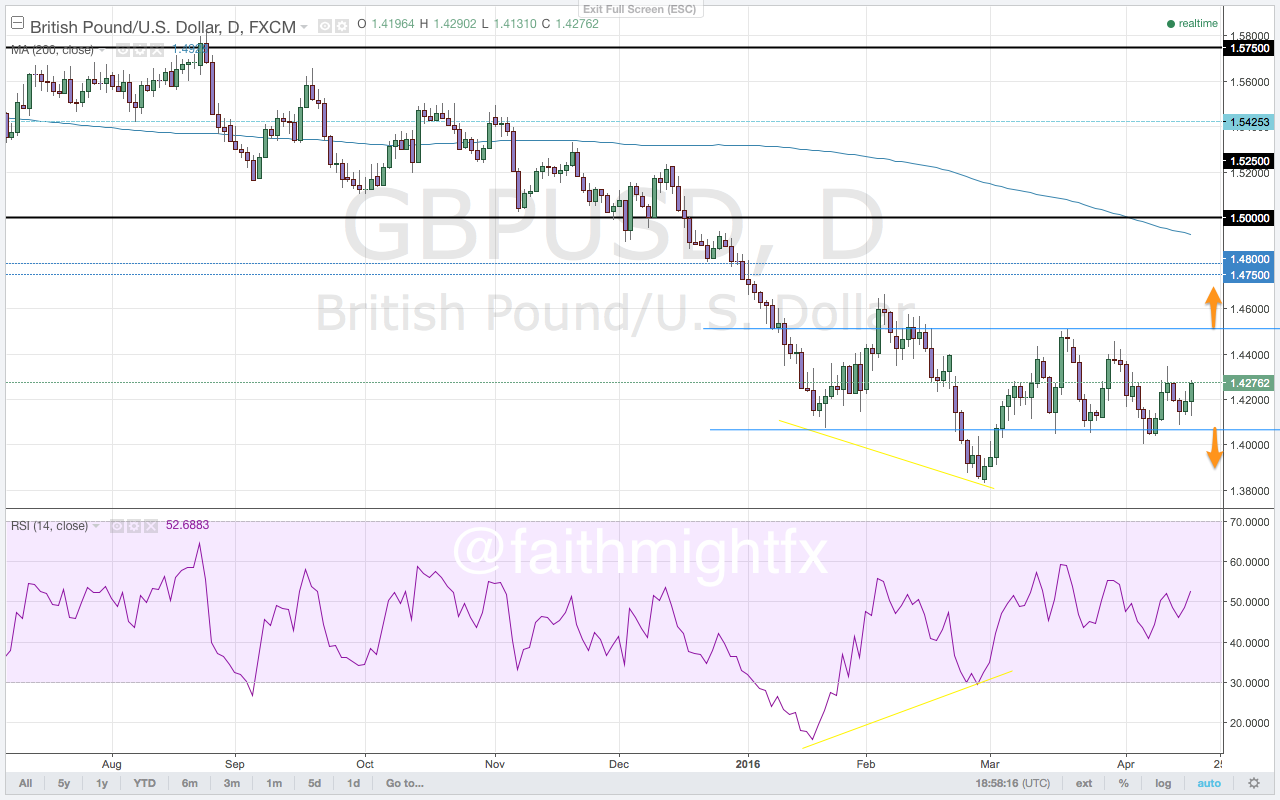
This is our look at cable ahead of the FOMC meeting:
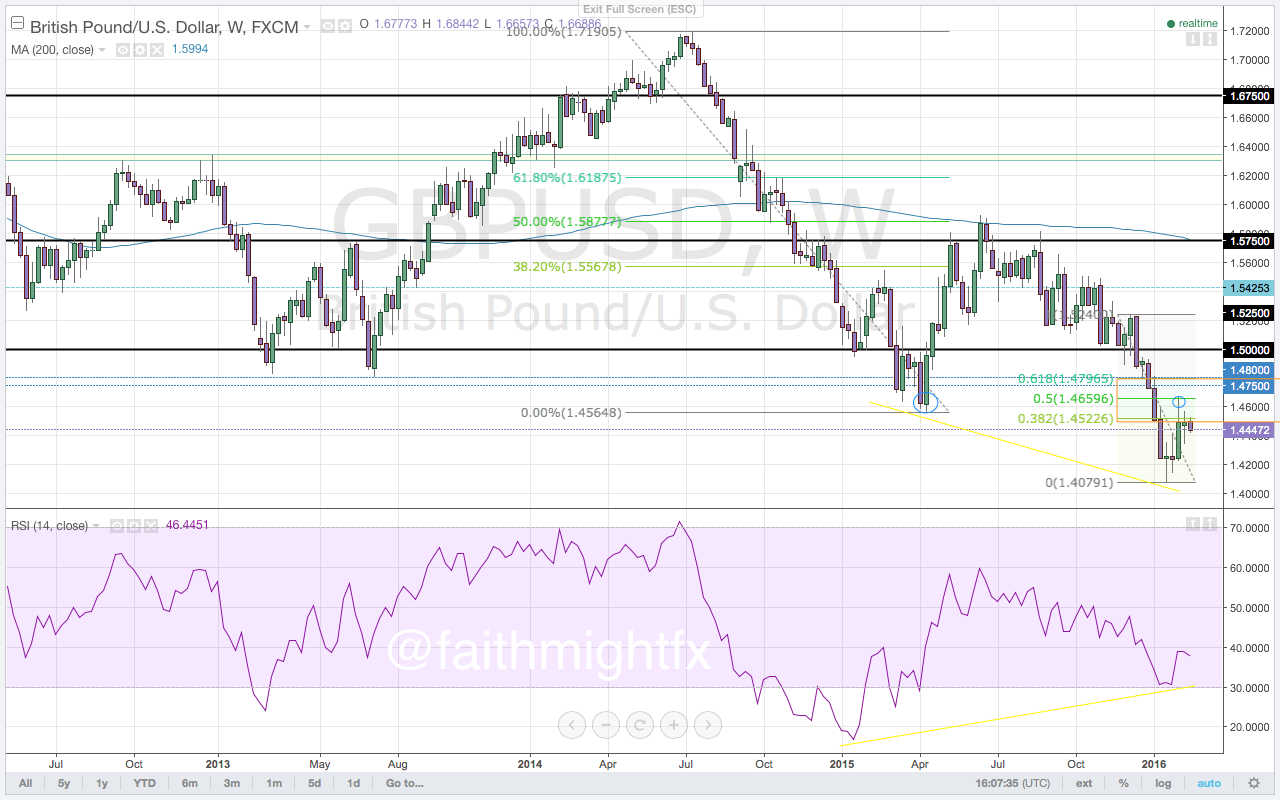
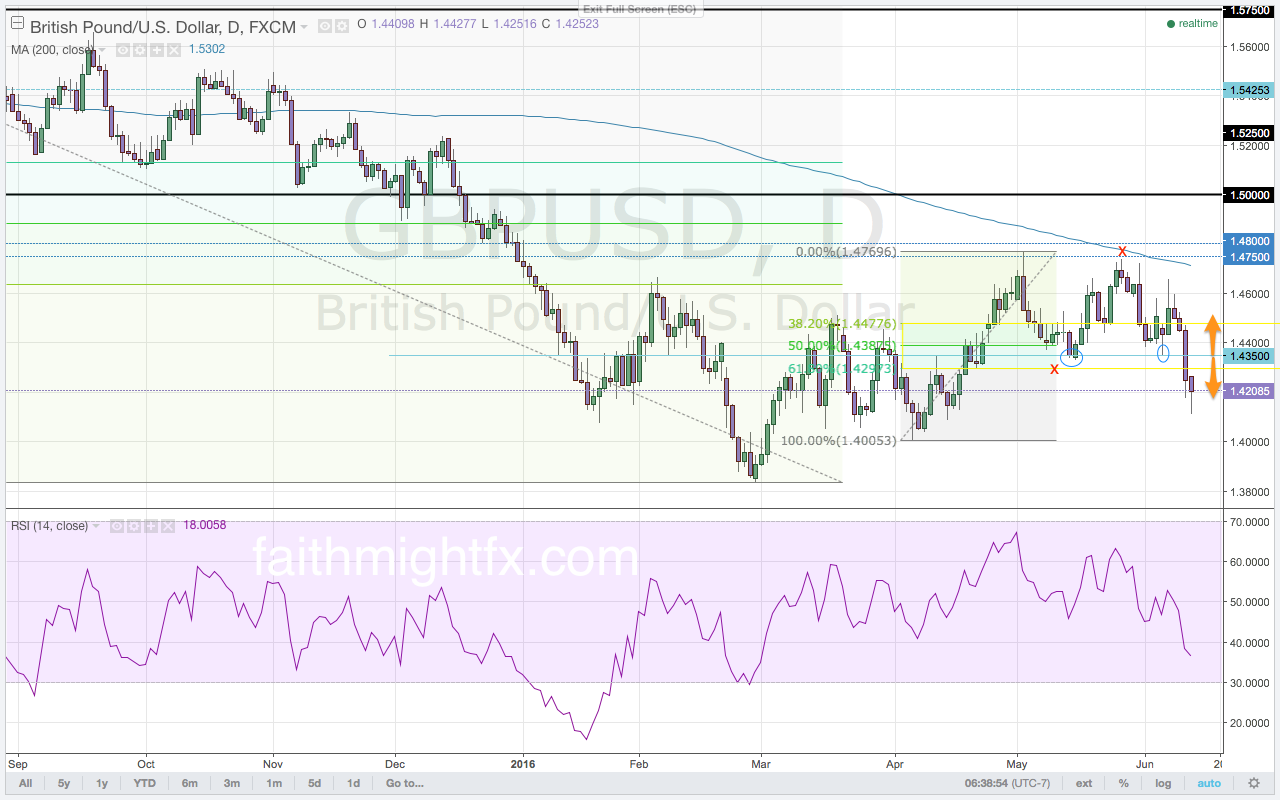
As price met resistance in the zone between the 1.4750 and 1.4800 levels, momentum exhausted in like fashion to move into bearish territory. The U.S. dollar looks to accelerate weakness after another disappointing non-farm payrolls report was released last week. This weak jobs report should have been evident in the midst of all the weak U.S. economic data that had been released prior, namely the weak GDP number, the weak retail sales, the weak manufacturing numbers and the weak inflation numbers. The weight of evidence points to a weaker U.S. economy. Many market participants would begin to think that all of the weak economic data out of the U.S. would now start to weaken the U.S. dollar more substantially. If markets begin to sell the U.S. dollar en masse, the $GBPUSD will move back towards the 1.4769 highs for a break higher to the major 1.5000-psychological level. However, this will not be the scenario that plays out. The market will begin buying U.S. dollars in anticipation of an interest rate hike by the Federal Reserve later this year. The Friday close below the 1.4350-support level signals a move to the bottom of the range at 1.4000.
The event risk of the week for the U.S. dollar is the Federal Reserve monetary policy announcement. In response to the disappointing U.S. jobs reports, markets have already discounted this month’s Federal Reserve monetary policy meeting as a non-event. Rather, markets have begun to price in an interest rate hike at the July meeting. Market participants will, therefore, be keen to hear hints about a rate hike taking place either as soon as July or delayed further until December. Hawkish hints will trigger more dollar buying flows.
Premium trade setups with targets and stops are published in the GBP/USD Outlook for the Week in Volume 66, this week’s Quid Report.