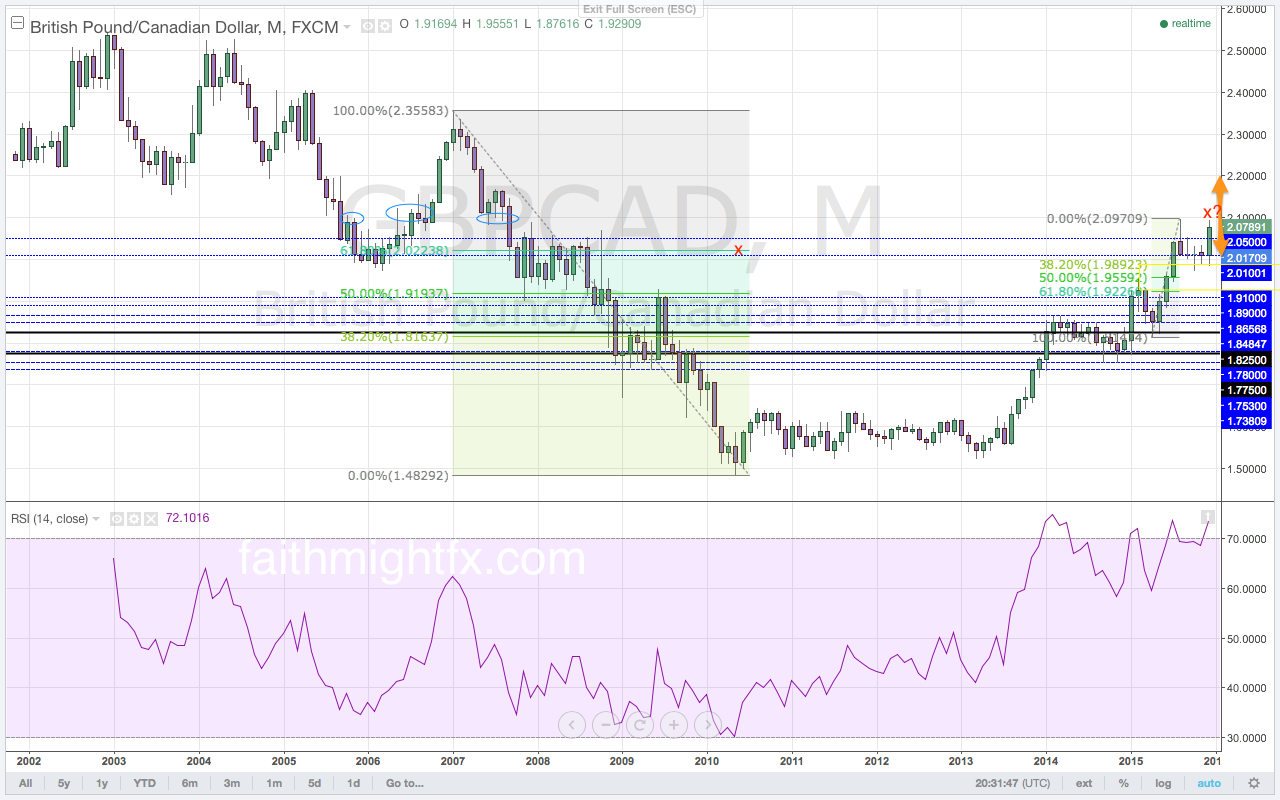
The Canadian dollar is starting to decouple from the crude oil markets. As crude oil markets plunge, the Canadian dollar also moves lower but not particularly against the pound sterling. The $GBPCAD reached multi-year highs just below the 2.1000 major resistance and psychological level twice in 2015. But despite crude oil prices crashing lower in 2016, the $GBPCAD has been unable to break above the 2.1000 level to new multi-year highs. The oil glut that caused the oil markets to accelerate its decline in the past seven months continues to persist. There is an oversupply of oil in the markets. Oil producers remain in denial to decreased demand for fossil fuels and refuse to cut production. Or perhaps some oil-producing nations are conducting economic warfare as they continue to pump oil. Regardless of the reason, this supply glut will keep crude oil prices low in 2016. Oil markets open the new trading week moving lower still even after the multi-year low Friday close. The crude oil markets continue to lead all commodity markets lower as the new trading week gets underway. However, while last week we believed that any strength in oil would present a buying opportunity in the $GBPCAD (Volume 45), this week that perspective has changed. Any rally in the $GBPCAD this week will be seen as a selling opportunity. Only a close above the 2.1000 resistance level will keep the bullish trend intact.
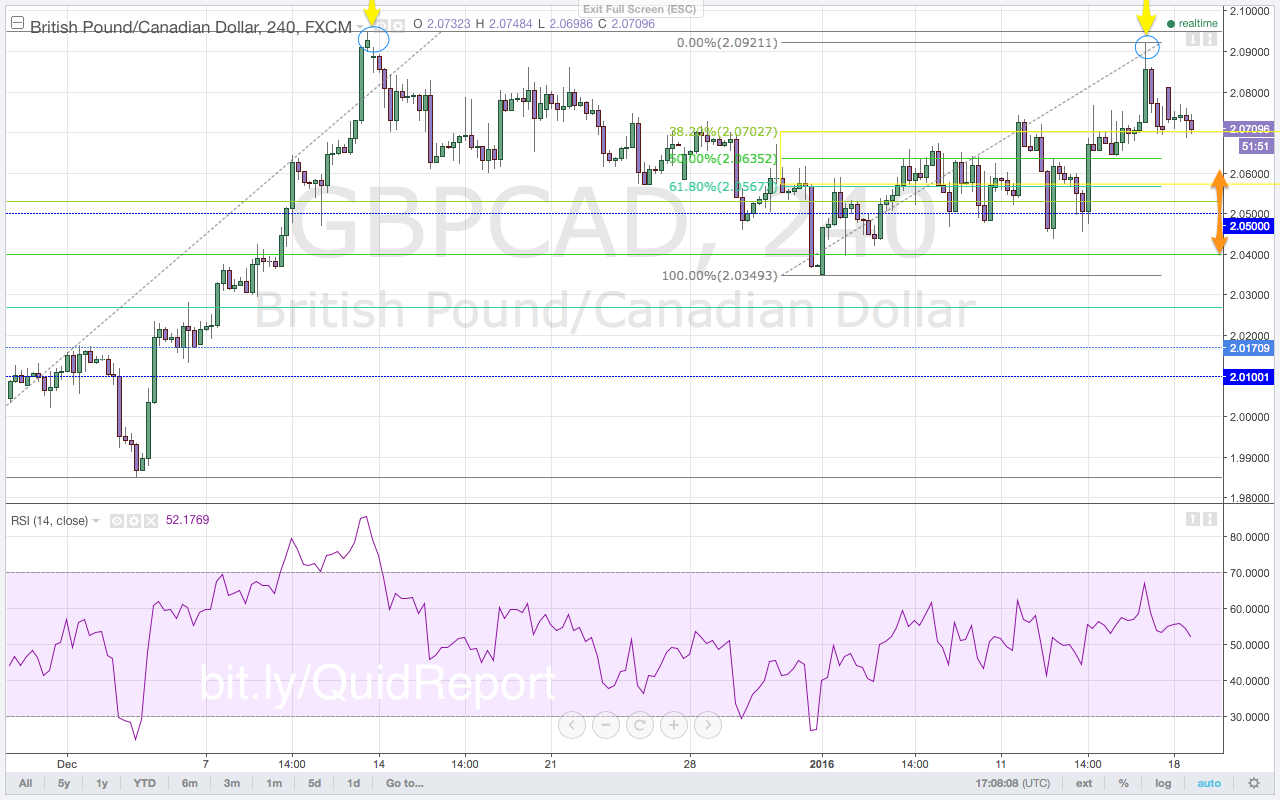
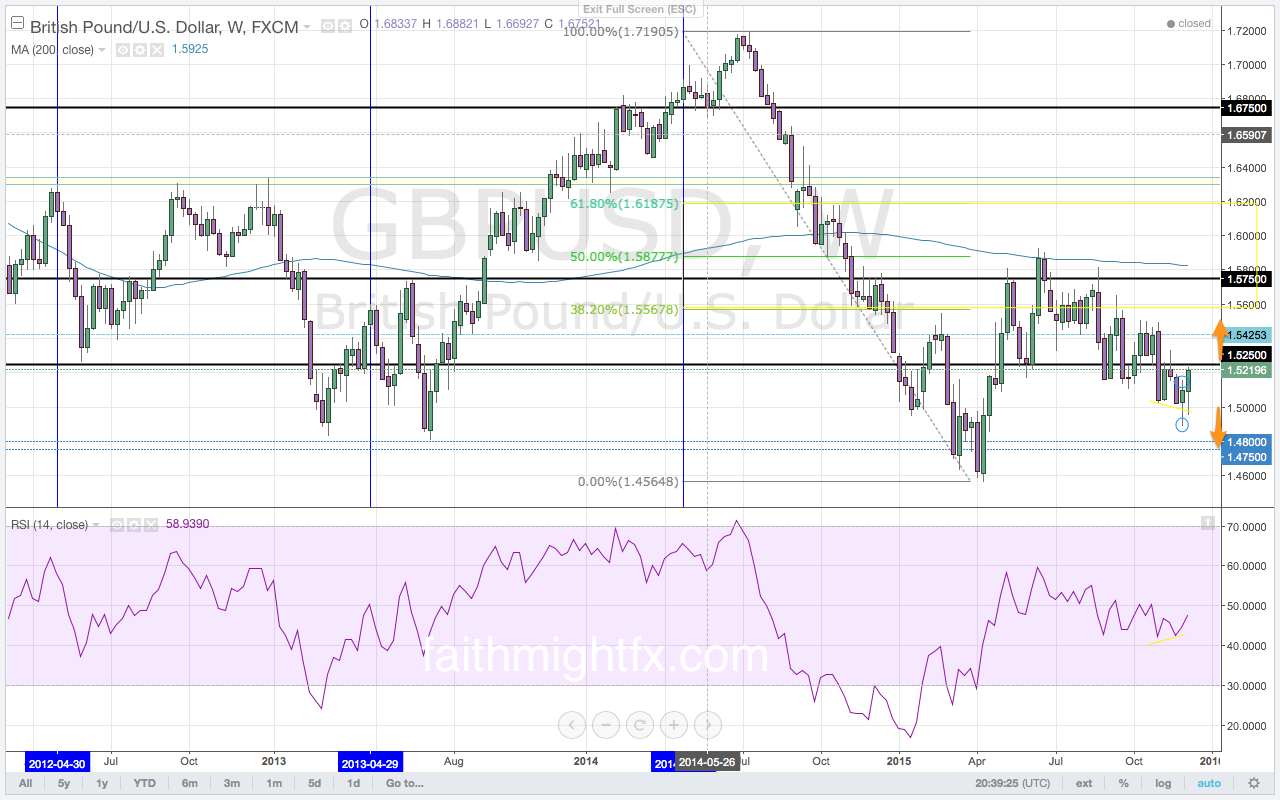
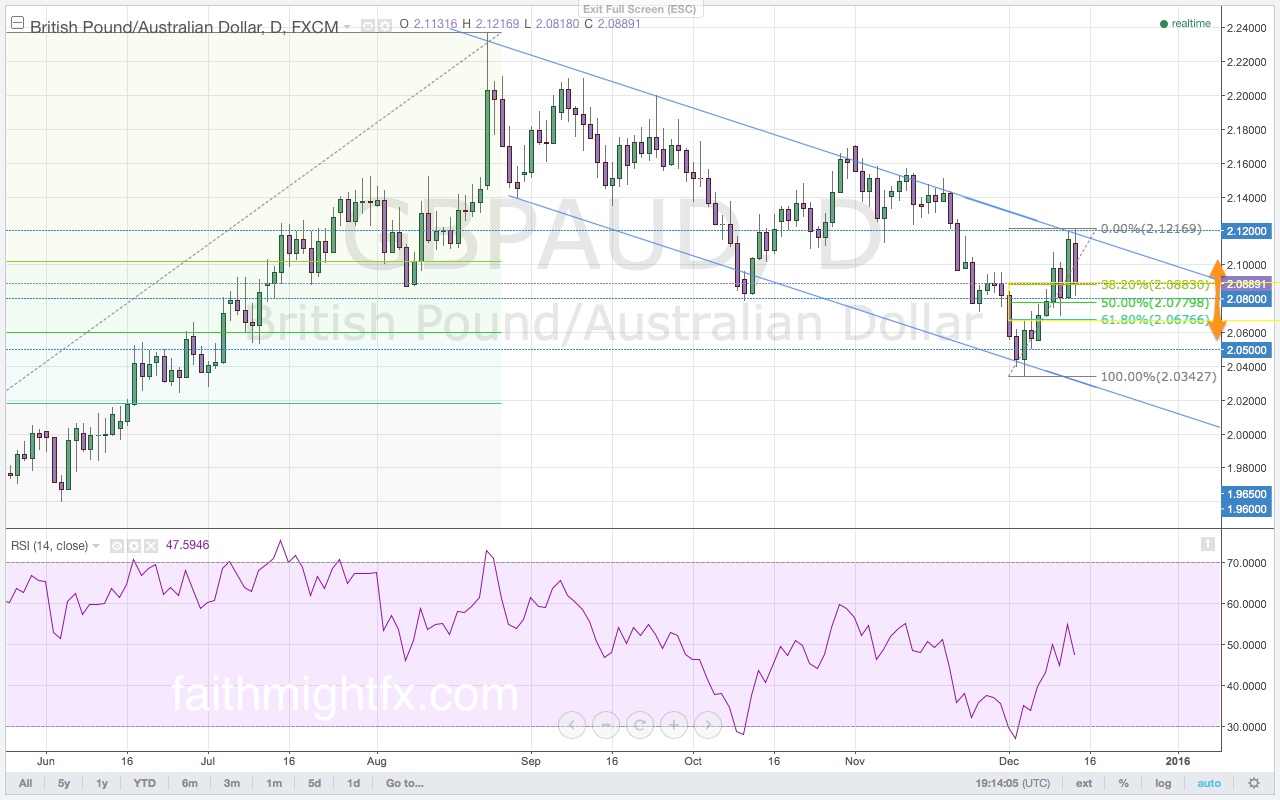
With the weak pound sterling, it is difficult for the $GBPCAD to rally even with the weak oil market. The moves have become biased to the downside this week as price continues to print lower highs and decreasing bullish momentum. Signaled by the Friday close, the new trading week opens with sellers stepping in at the gap-open highs. As price moves higher, the 2.1000 resistance level will be the signal for future price action. A confirmed close above the 2.1000 level will allow buyers to gain position and base for a move higher. However, if price rallies again and holds below the 2.1000 resistance level, the $GBPCAD will move to the 61.8% Fibonacci level on the daily chart. A rally in price back to the highs will be an opportunity for buyers to cover long positions. The failed high at 2.0949 continues to signal a deeper correction to the 1.9800 support level.
Premium trade setups with targets and stops are published in the GBP/CAD Outlook for the Week in Volume 46, this week’s Quid Report. This is an excerpt from Quid Report.