fbpx

Bank Of America Failed To Break The Support Level

In December last year, Bank Of America share price was as low as 22.73. As the American market went down towards the end of 2018, $BAC also joined in the dip. After this dip, price rallied to the 26.77 level, which initiated to a strong support. There was a gap up on the 16th of January which made price to reach 29.64. After this gap up, a correction has occurred but the price of $BAC was not able to break the support level at 26.77.
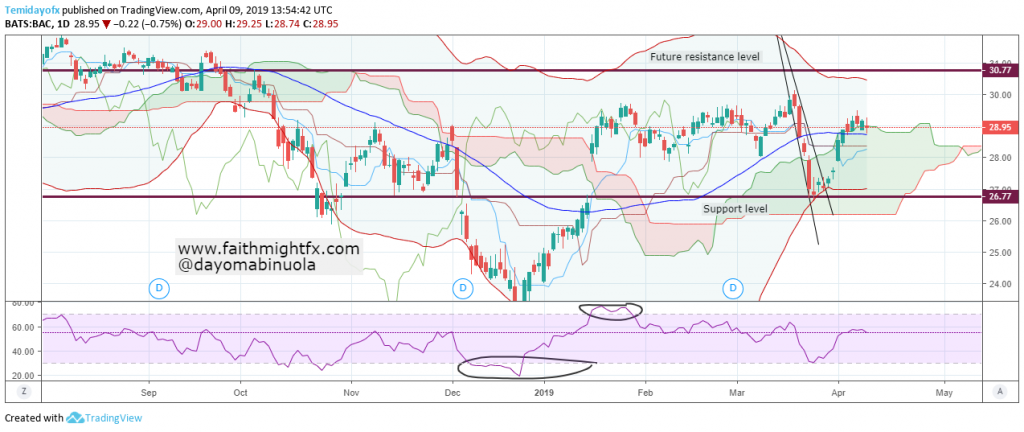
Bank OF America Daily Chart


The correction after the gap up made price to cross to the lower region of the Bollinger bands. The trendlines have been broken and indications show a bullish takeover begins. Though we expect the $BAC bulls in the market, Ichimoku has not shown a bullish signal but showed a bearish signal instead. On the daily chart, price of $BAC is overbought. Price being overbought might be deceptive for the bears to get into the market. Currently, price of $BAC has been able to cross to the upper region of the bands. So price of $BAC could reach the next resistance level at 30.77 from its current 28.95.
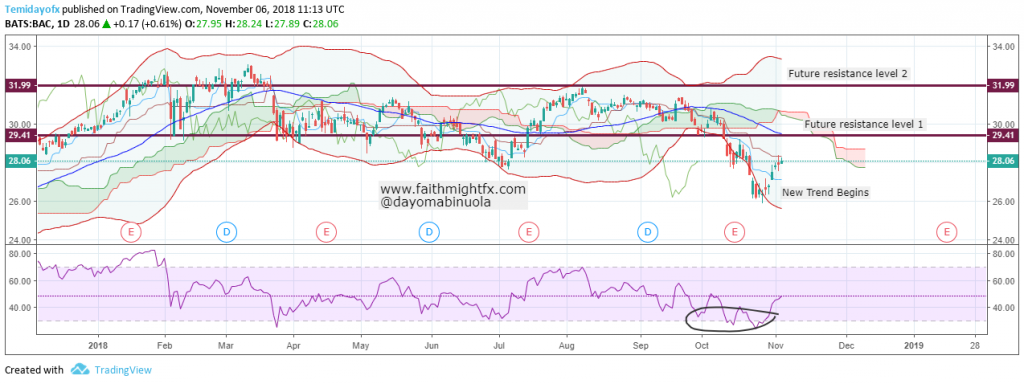
Bank Of America Gaining Strength After A Fall In Market Price

The market value of $BAC worsened in September reaching 25.99 from 30.12. Price rallied majorly between 29.41 and 31.99 throughout this year. $BAC has maintained stability in market price for the most part of 2018. After a fall in price in September, price reached a new low since mid-November 2017. Price movement this year reached 33.05 in March making it the highest price point of $BAC reached since the financial crisis in 2008. Investors might have been undergoing discomfort during the times the market was in a range. In July, price gave a signal of a future downtrend which later occurred in September with over 400 points.


More investors bought shares of $BofA after a new support level was reached in October. Over 100 points was gathered last week when buyers resumed. The RSI on the daily chart shows price has been oversold. If more buyers come on board, price might reach a new resistance at 29.41. Eventually, if price goes up and moves beyond the first resistance level, price might reach 31.00. Though price movement is in the lower region of the band, it could continue higher if price closes above the upper region of the band, it could continue the bullish movement.