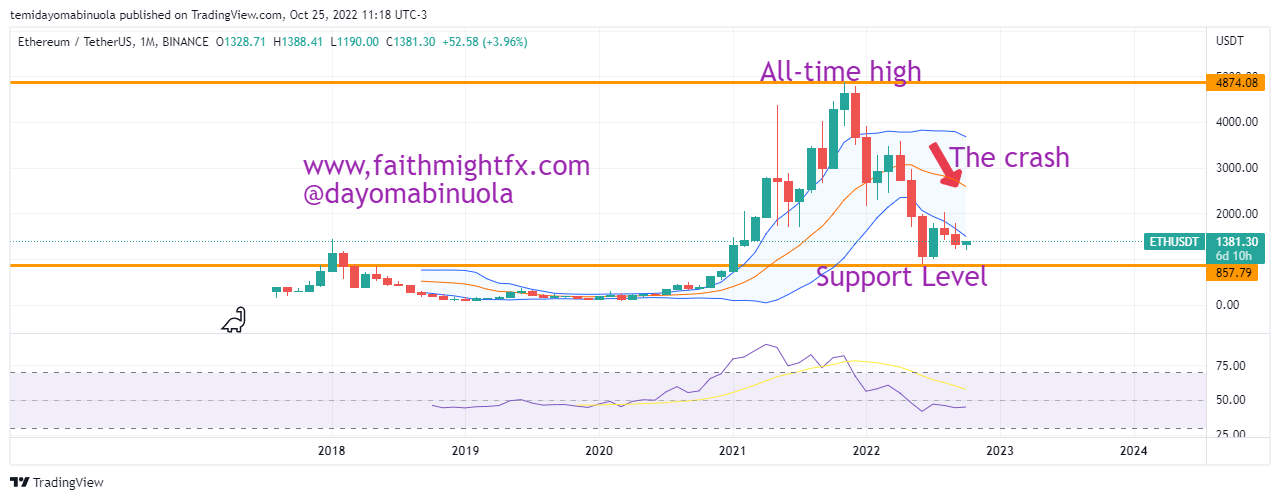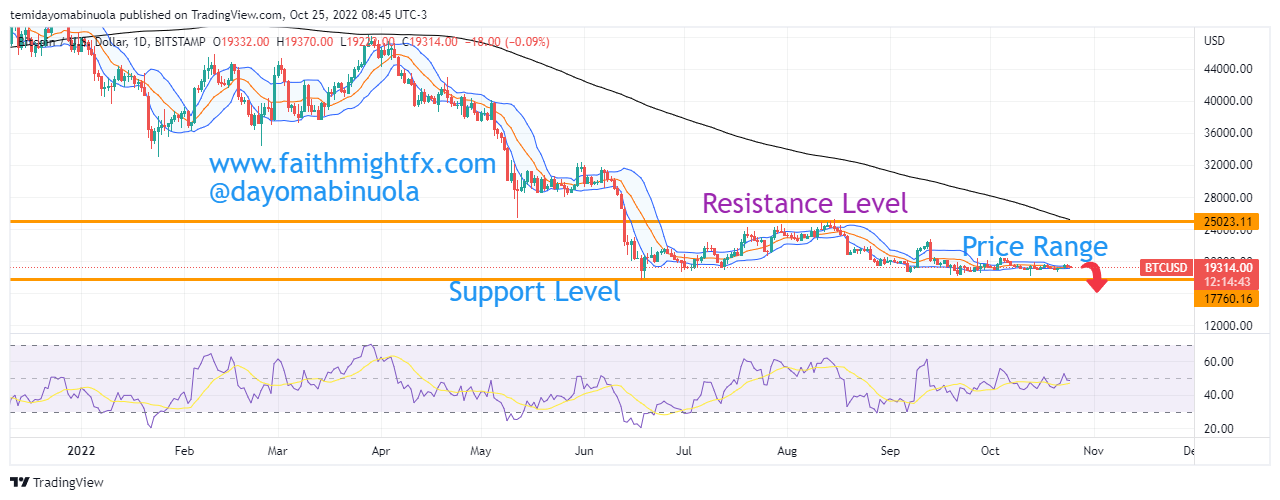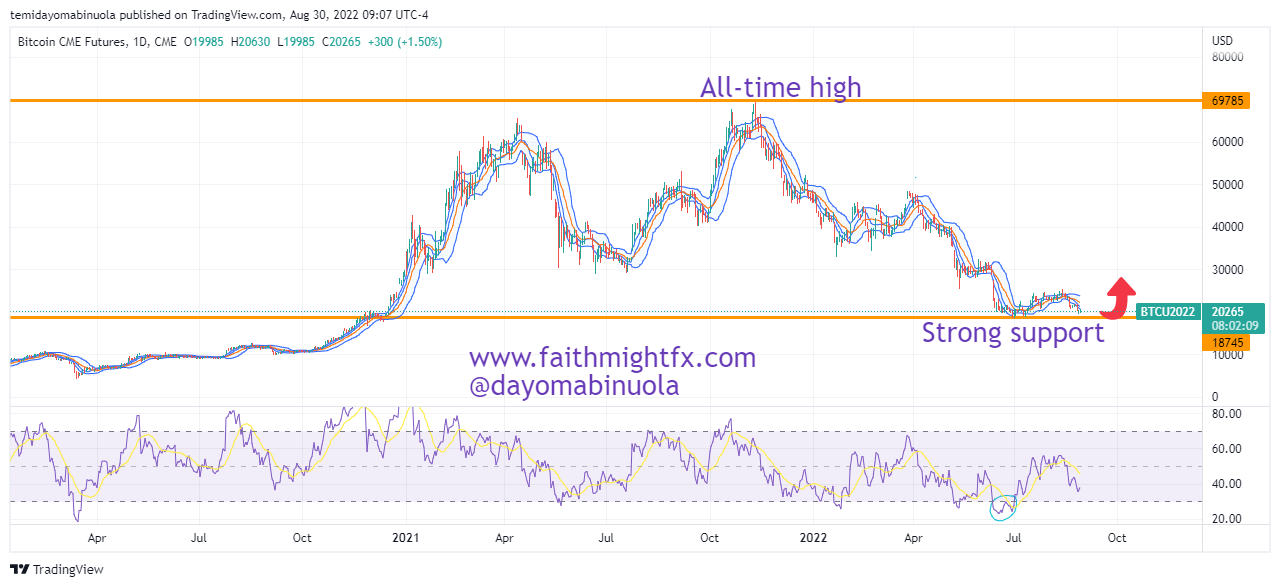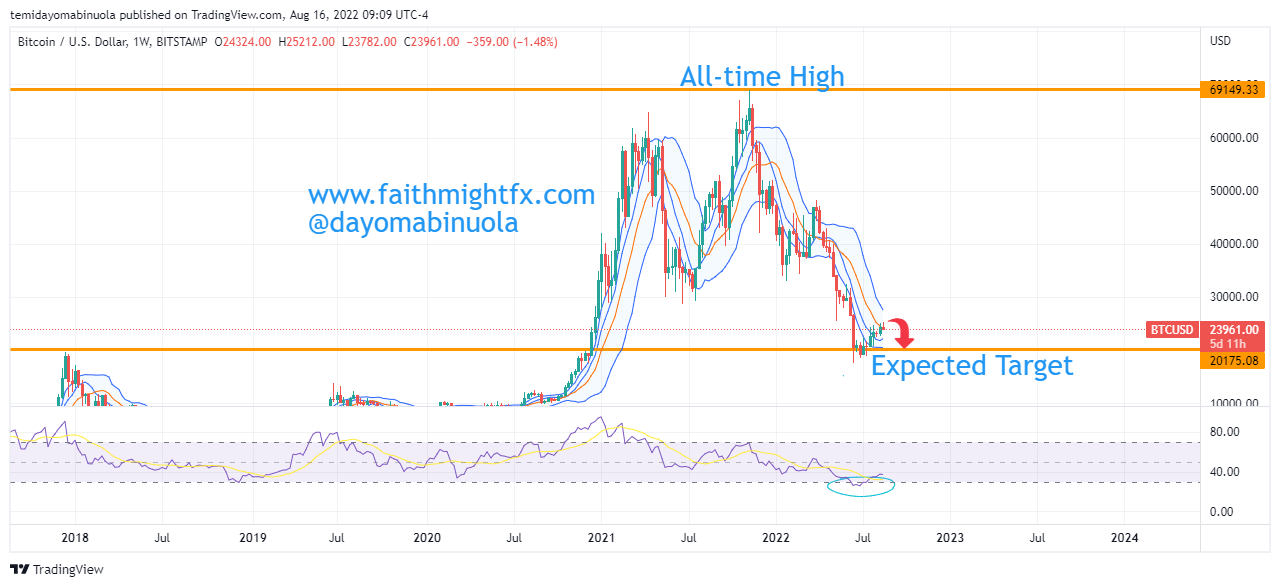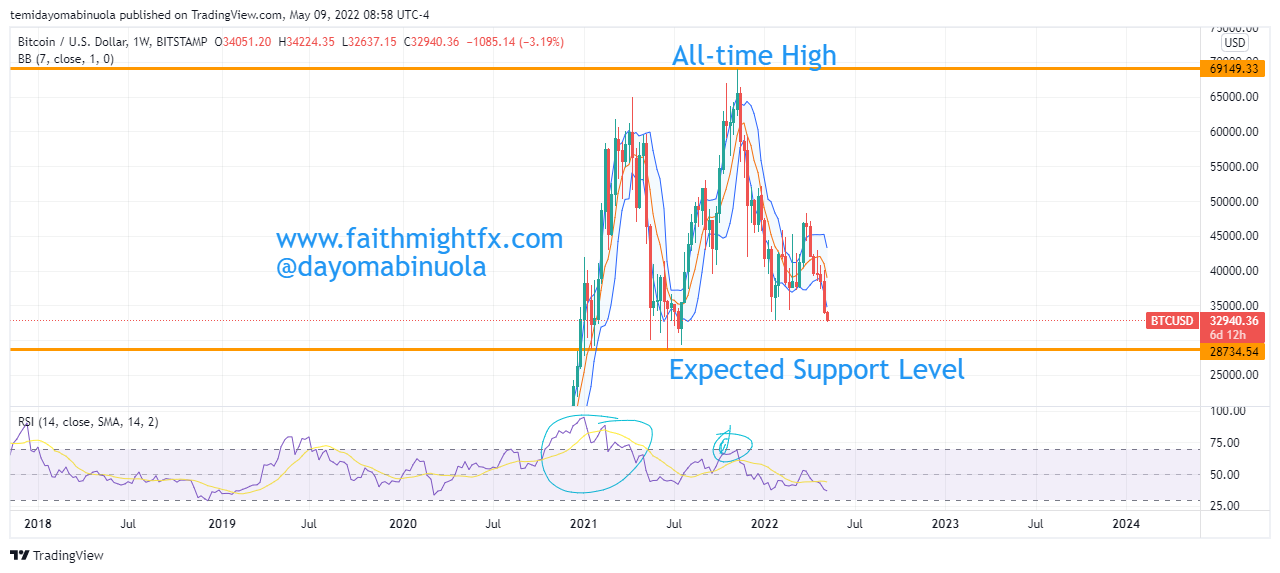
2022 was not a good year for Bitcoin investors. The opening price of the year was $46,184 and the year ended at $16,523. This was about a 64% loss in the value of Bitcoin. On the daily chart, Bitcoin experienced lower highs and lower lows. The highest point Bitcoin reached in 2022 was $48,185 which was in March.
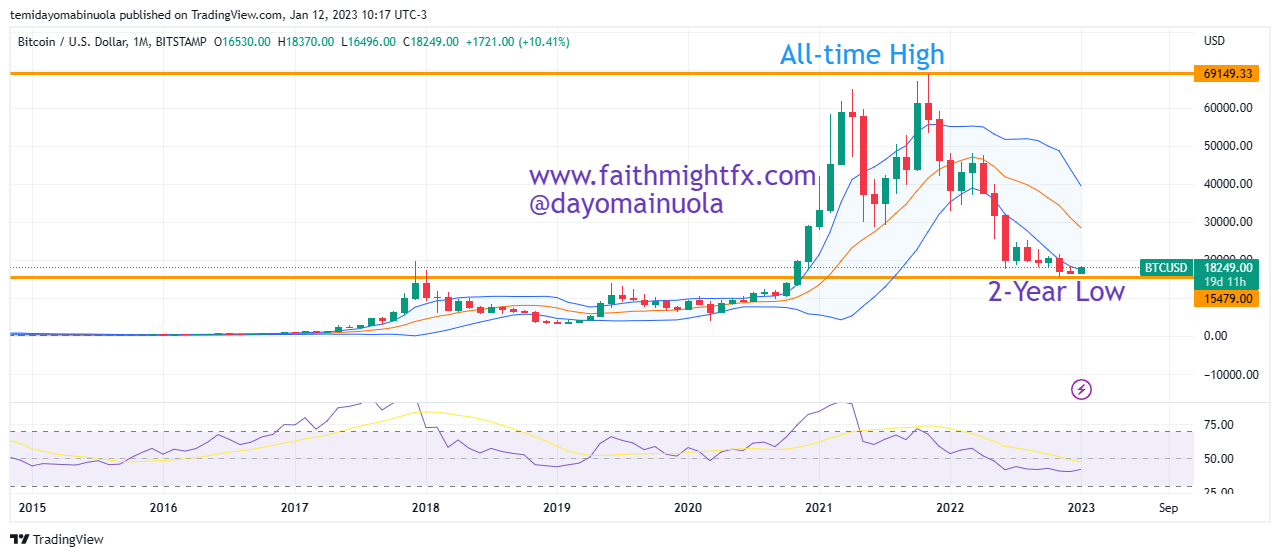
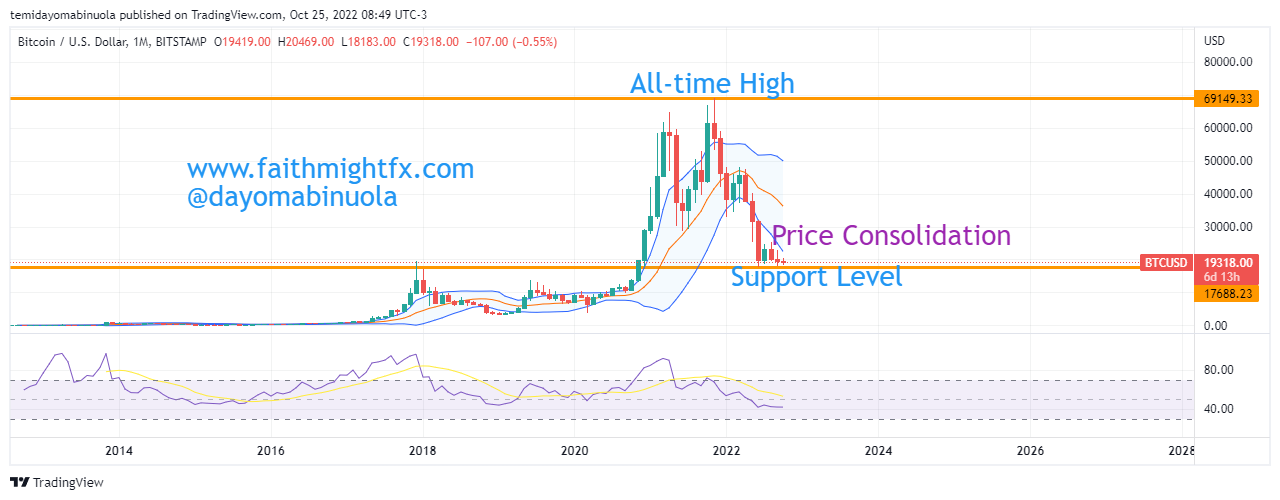
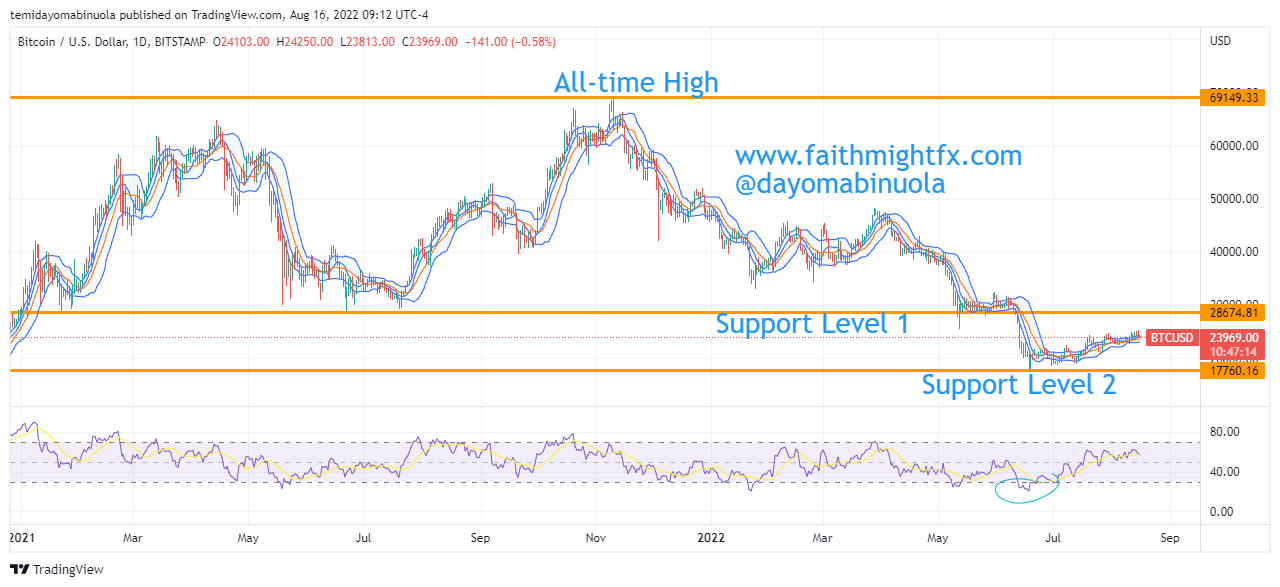
Bitcoin opened in 2023 at $16,538. Studying the technicals, it is clear that the price of Bitcoin has been ranging between $15,880 and $21,500 since November 2022. As the year 2023 began, Bitcoin saw a brief rally to $17,400 which stands as the 2023 high, and simultaneously the highest point in 4 weeks.
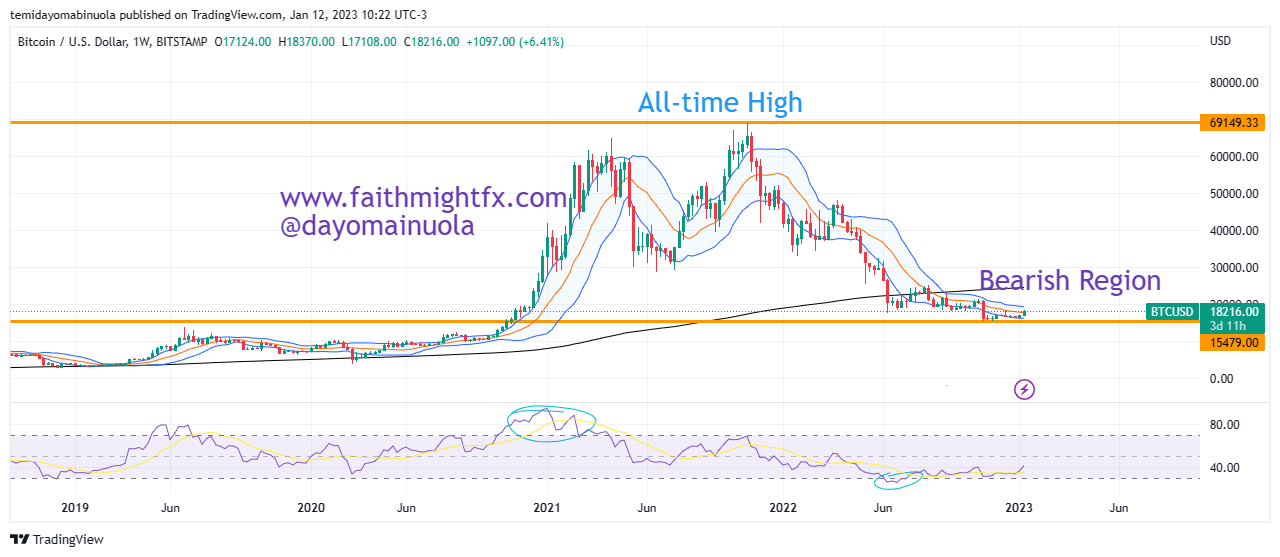
However, looking at the entire year of 2022, Bitcoin is currently experiencing a weak bullish momentum as the bears are still in control of the crypto market. If BTC price tries to rally from the current price of $17,287, it might be counteracted by the aggressive bears and price may fall back to the support level of $16,000.
Some of these ideas are in our clients’ portfolios. To understand if this one can work for you or for help to invest your own wealth, talk to our advisors at FM Capital Group. Would you like more information on how to get cryptos your portfolio? Schedule a meeting with us here