fbpx

NZDUSD TO FALL

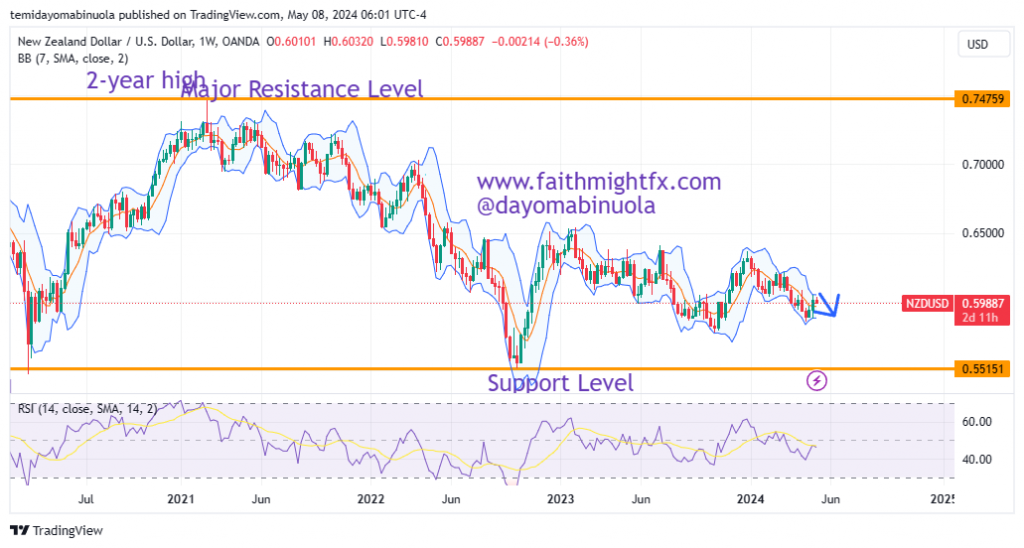
The kiwi has not been doing so well since the beginning of the year. The opening price of NZDUSD in 2024 was 0.63293, and the lowest price this year is 0.58503, in April 2024. The Kiwi’s downtrend had begun in February 2021 at a major resistance level at 0.74759. On the weekly chart, a hammer has been formed at the support level at 0.58503, which has led to a rally from the week of April 15. The current price of the kiwi is at 0.59821.
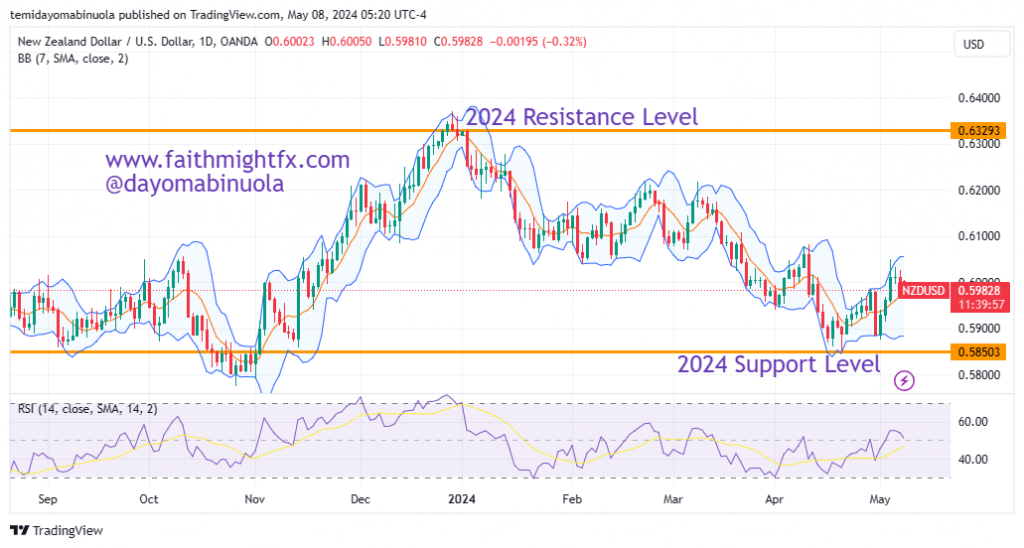
The correction in the price of the kiwi has made price rally to the recent high at 0.60495. The USD is beginning to gain against the NZD. Since February 2023 until now, the price of Kiwi has been moving between 0.57784 at the support level to the resistance level at 0.64218. We might see the price of the kiwi fall to 0.59080 in the coming days, as the bulls are beginning to lose momentum.
Some of these ideas are in our clients’ portfolios. To understand if this one can work for you or for help to invest your own wealth, talk to our advisors at FM Capital Group. Would you like more information on how to get currency in your portfolio? Schedule a meeting with us here
GBPUSD Finds New Support Level

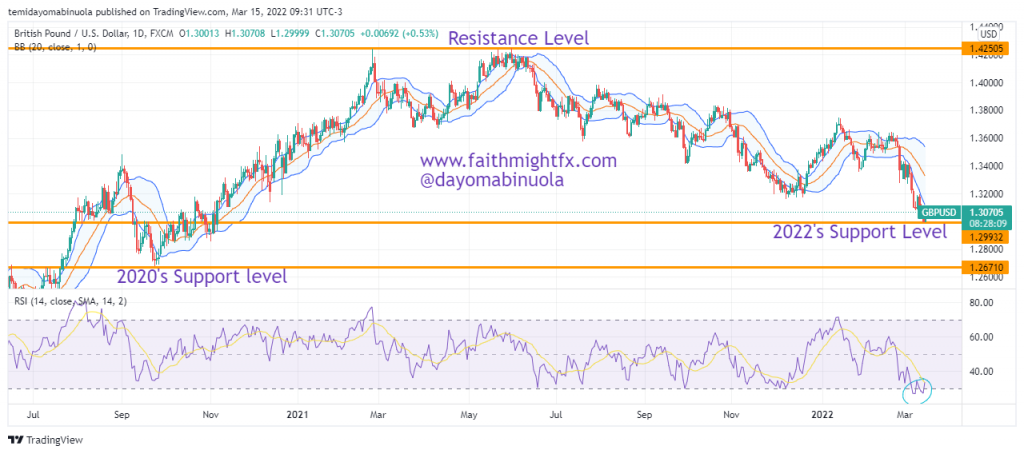
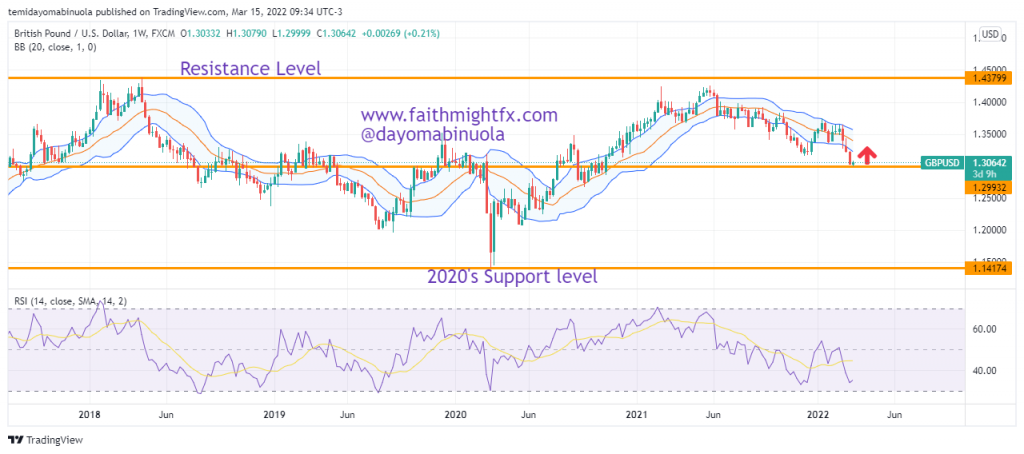
In March 2020, $GBPUSD went as low as 1.14144. After this low, the bulls took over and a rally pushed the price to 1.42614, the highest price between 2018 and now. $GBPUSD opened at the beginning of the year 2022 at 1.35313. Since the beginning of the year, the price has appreciated from the opening price to 1.37512 which is currently the year’s high. The bulls however could not maintain this momentum as the bears hijacked the trend and pushed the pair to a new support level at 1.30020.

This new support level is lower than the opening price of the year which means GBP has lost all it gained this year against the USD. There are indications of a bullish run in the next couple of weeks which signifies that GBP will appreciate against the USD. On the daily time frame, RSI has indicated that the price is oversold. We forecast that the price will rise to 1.34298.

Some of these ideas are in our clients’ portfolios. To understand if this one can work for you or for help to invest your own wealth, talk to our advisors at FM Capital Group. Would you like more information on how to get stocks in your portfolio? Schedule a meeting with us here.

EURJPY, A Pair With A Double Bottom

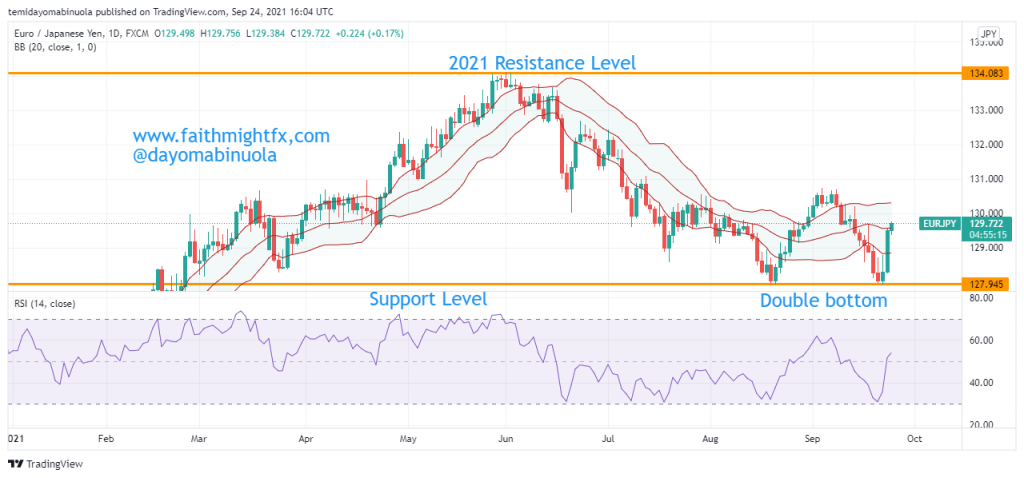
The year 2020 was good for the EURJPY bulls after the price opened at $121.92 and closed at $126.11. . Taking a further look at $EURJPY, the first half of this year was full of higher highs and higher lows till June. The bears took charge of the EURJPY pair after the highest level in the year was reached on the 1st of June, at $134.09 when the price began the downward trend.  

The 4hr chart has shown multiple oversold positions, which could be an indication of a possible rally. There is a likelihood $EURJPY reaches $130.58 in the coming weeks as last week’s candlestick was bullish. A double bottom has been formed at $127.90 in the month of August and September. As the price is currently at $129.64, we should be seeing price movement towards the psychological level at $130.00 next week. News released shows Sweden producer price index surged in August by 1.8%; the Italian consumer confidence improved in September as of today.  These could be the reasons the EUR has been appreciating against the YEN.

GBP Is Beginning To Gain Against The USD

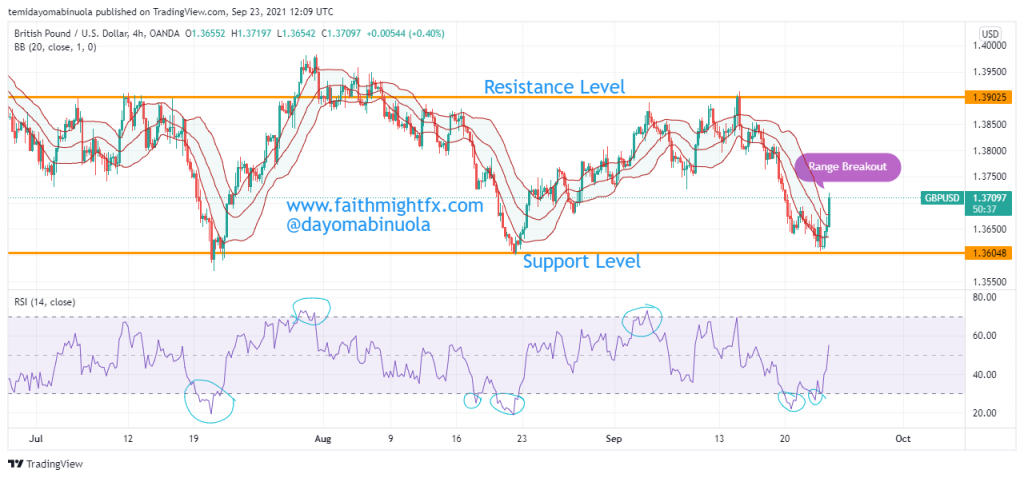
GBPUSD has crossed to the bull region since the lockdown in 2020, making the GBP gain against the USD. The appreciation has led to a new high at 1.42634 since 2018. The lowest price of $GBPUSD at 1.14242 was reached during the lockdown. The monthly chart shows the pounds a W pattern is about to be formed, which indicates a continued bullish movement. In the last 3 months, $GBPUSD has maintained a support level of $1.36048 at three different times. Price could not break the support to the downside. The GBP might be appreciating against the USD for the new few years.

RSI shows price has been oversold 5 times in the past 3 months and overbought at two different instances. The $GBPUSD bulls are willing to push higher. Last week, the price has been ranging around 1.39611 and 1.36048, but a breakout just occurred.  This breakout might follow a similar pattern it has followed in July and August. If the price fails to break out the resistance level at 1.39025, then a correction might occur. But as it stands, a breakout is likely to occur, as the price has crossed to the higher region of the Bollinger bands. If the price closes in the upper region of the Bollinger bands, the bullish movement might continue.

EURUSD Tries to Break Support Level

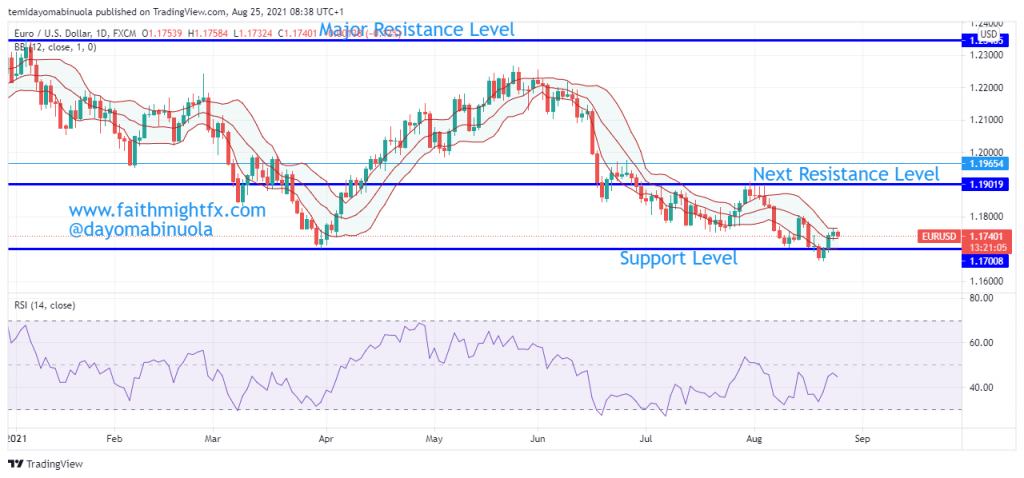
In May 2018, a EURUSD dip started as the price fell below 1.16997 and went as low as 1.06394., this was over 1000pips. Later in 2020, The EURUSD bulls pushed the price upward to a new resistance at 1.16997 in July 2020, and in August 2020 it stood as support. The EUR has gained so much against the dollar since after the ease of lockdown in 2020.

In April 2021, EURUSD had a bullish run from a support level at 1.7032 to 1,22651 in the last trading week in May. The bears took over and pushed the price to the support level at 1.7032. There was a fake-out to the downside, price has tried to retrace with three bullish candlesticks in the last 4 trading days. At the beginning of August 2020, the bulls tried to break the minor resistance level at 1.19019 to the upside, but instead, the bears pushed the price lower. As we see the bull power gaining momentum in the past 3 trading days, we might see the price reach the next resistance level at 1.19019. A breakout to the upside might push the price towards the major resistance level at 1.23465.

Between June and July, RSI has revealed 2 oversold positions. This could be an indication of a possible reversal.