fbpx

FTSE 100 Continues To Dip

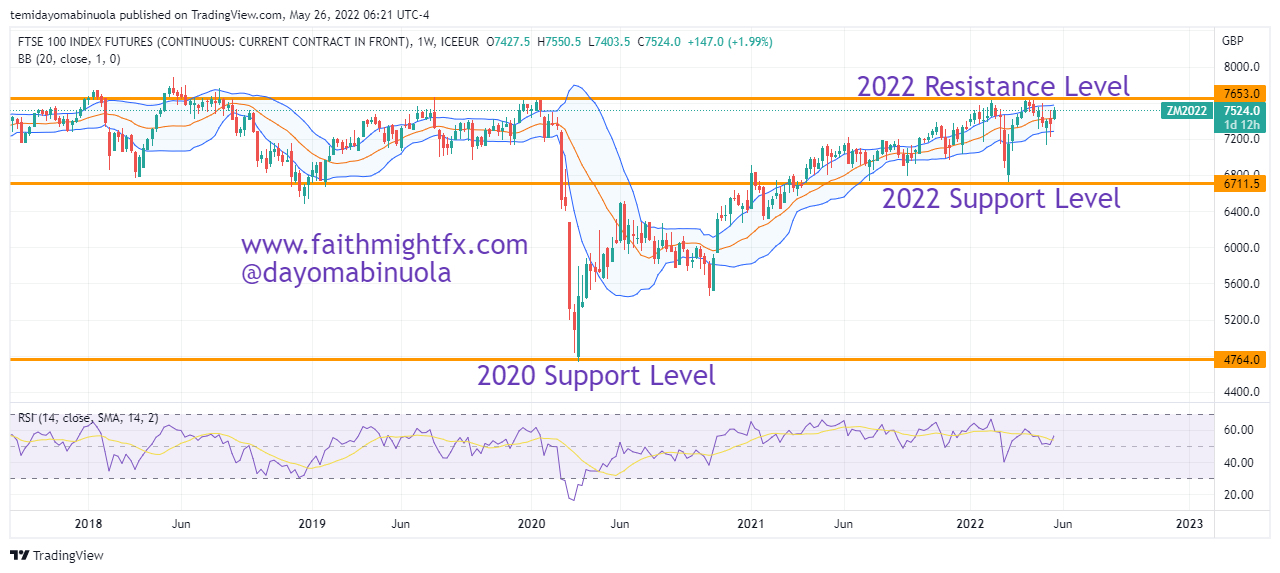
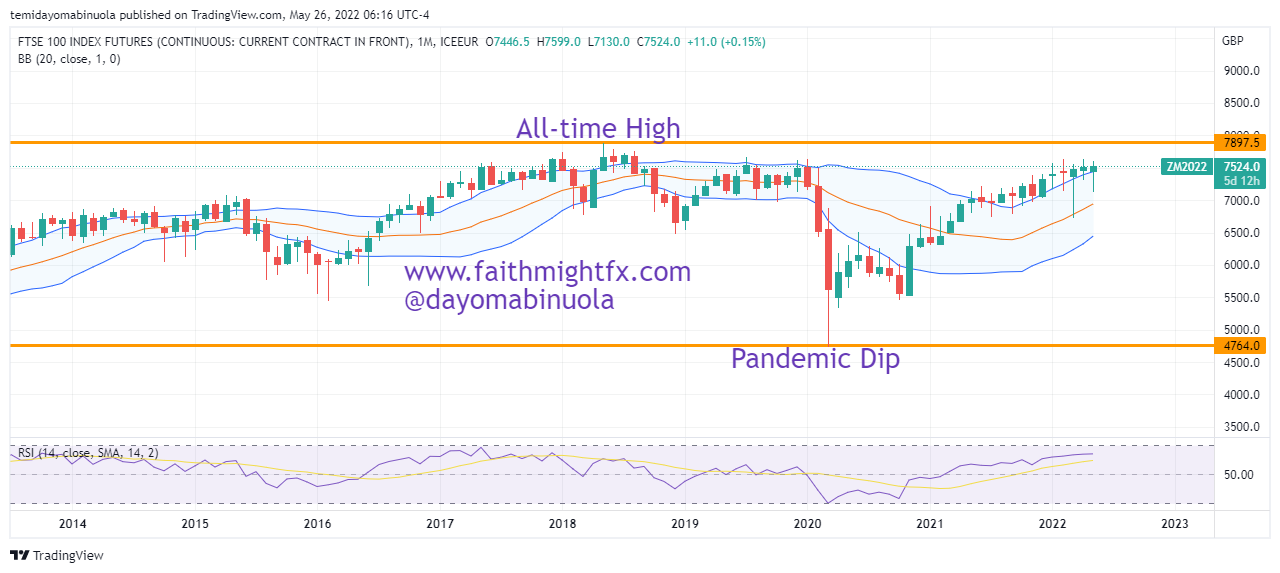
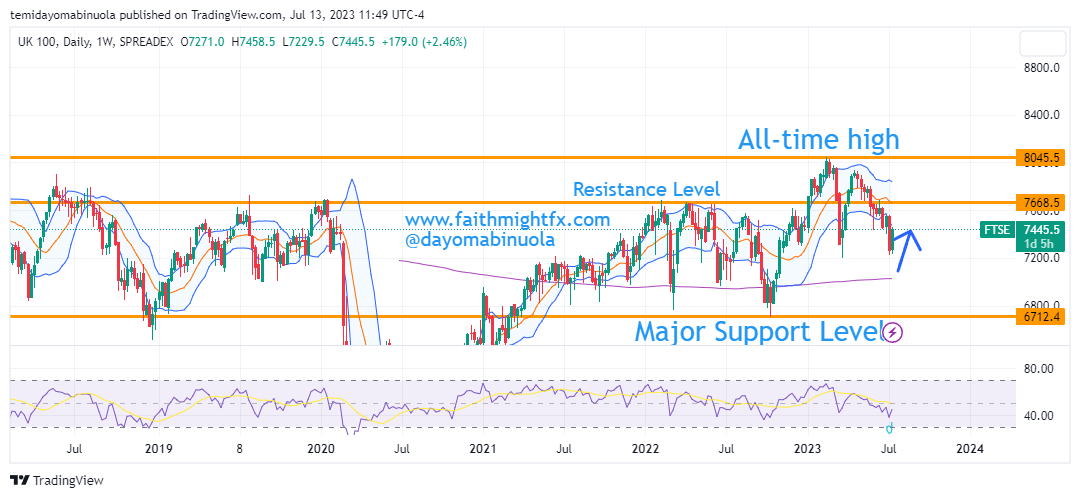
On the 4th of January 2023, we wrote an article on our outlook for FTSE 100 in 2023. In this article, our analysts concluded that there will be a rally in 2023 which will lead to a breakout of the 2022 resistance level of 7682. The breakout occurred in January 2023. After price broke out, the rally continued as FTSE 100 reached an all-time high of 8040 in February 2023.

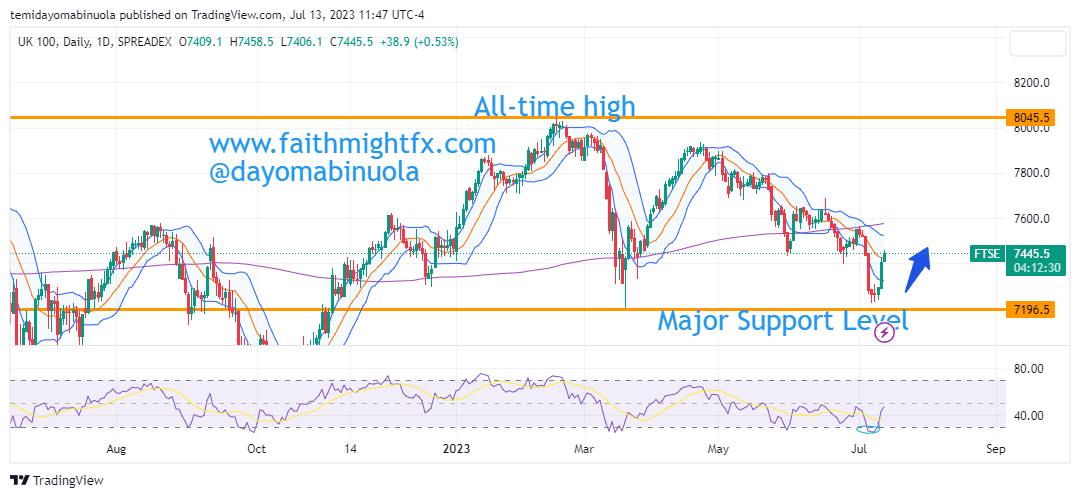
The value has continued to drop since the price reached 8040. As of the time of publishing this article, FTSE’s price has fallen to 7268 which is lower than the opening price of the year which was 7457. This indicates that all gains in 2023 have been lost. Based on our analysis, we might be seeing price of FTSE 100 bounce above 7600 in the coming weeks.

Some of these ideas are in our clients’ portfolios. To understand if this one can work for you or for help to invest your own wealth, talk to our advisors at FM Capital Group. Would you like more information on how to get stock indicies in your portfolio? Schedule a meeting with us here.

FTSE 100 Index consolidates above 7000

The FTSE 100 Index is a share index of 100 companies listed on the London Stock Exchange. The total market cap as of April 2022 was £1.996trillion. It was launched on the Stock Exchange in 1984 by the FTSE group at an IPO price of 1650. Over the last three decades, long-term investors in FTSE 100 have seen its price reach an all-time high of 7900 which occurred in May 2018.

Weekly Chart

Enter COVID-19. FTSE 100 had been ranging pre-Covid after the all-time high in 2018. In March 2020, the price fell as low as 4800 which could have been a result of the slump in stocks across the world during that time. Following the lockdown ease, price rallied back above 7500 which was close to the all-time high of 7900 in 2018. 

Monthly Chart

Since the beginning of 2022, the highest opening price on the monthly chart is 7523 which was in February 2022. The worst close also was in February 2022 at 7388. RSI gave no indication that price has been overbought both on the weekly and monthly charts. Price is currently in the upper region of the Bollinger Bands on the longer timeframes. A breakout to the upside might occur as price looks to hit a new all-time high at a psychological level of 8000.

Some of these ideas are in our clients’ portfolios. To understand if this one can work for you or for help to invest your own wealth, talk to our advisors at FM Capital Group. Would you like more information on how to get stock indices in your portfolio? Schedule a meeting with us here